
Seller's Agent in 2020
Christine Durrence
Keller Williams Coastal Area P
(912) 657-6174
37 Total Sales
Estimated Value: $322,000 - $357,000
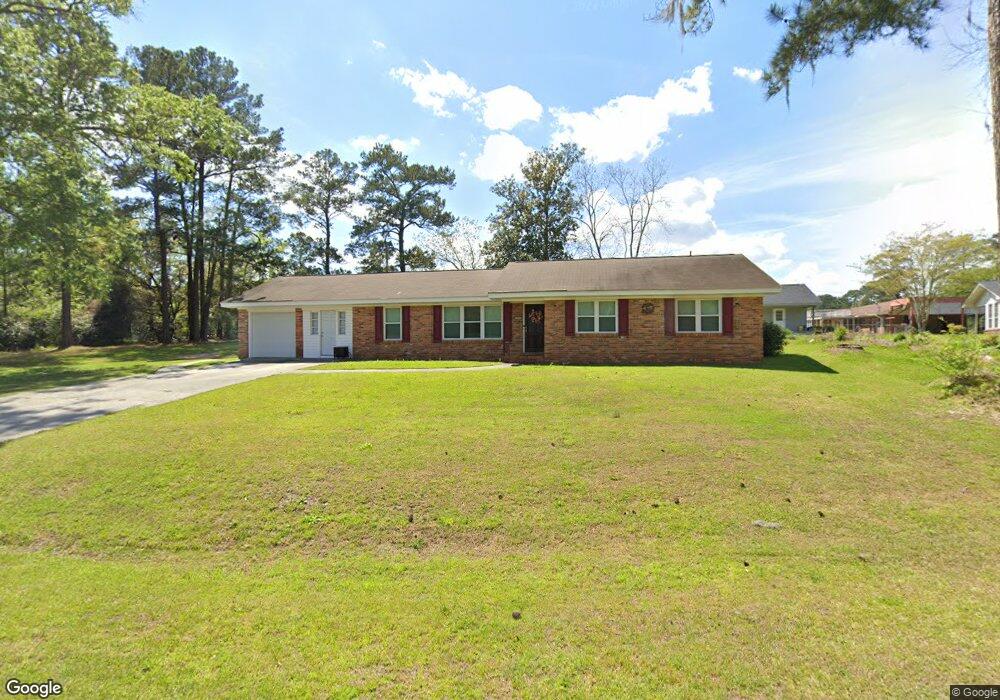
The oversized Living Room in this classic home features amazing space to spread yours wings. With the Dining Room, Breakfast Room, Kitchen and Study off the Living Area, everything is convenient and extremely well planned. The spacious back yard has room to play or just sit back and enjoy the evenings...centrally located in downtown Pooler, this diamond will not last long!
| Date | Buyer | Sale Price | Title Company |
|---|---|---|---|
| Cribbs Scott T | $216,900 | -- | |
| Acel Korey J | -- | -- |
| Date | Status | Borrower | Loan Amount |
|---|---|---|---|
| Open | Cribbs Scott T | $212,970 | |
| Closed | Cribbs Scott T | $7,592 |
| Date | Event | Price | List to Sale | Price per Sq Ft | Prior Sale |
|---|---|---|---|---|---|
| 10/29/2020 10/29/20 | Sold | $216,900 | 0.0% | $119 / Sq Ft | View Prior Sale |
| 10/10/2020 10/10/20 | Pending | -- | -- | -- | |
| 08/28/2020 08/28/20 | Price Changed | $216,900 | -0.9% | $119 / Sq Ft | |
| 07/31/2020 07/31/20 | Price Changed | $218,900 | -0.5% | $120 / Sq Ft | |
| 07/10/2020 07/10/20 | For Sale | $219,900 | -- | $120 / Sq Ft |
| Year | Tax Paid | Tax Assessment Tax Assessment Total Assessment is a certain percentage of the fair market value that is determined by local assessors to be the total taxable value of land and additions on the property. | Land | Improvement |
|---|---|---|---|---|
| 2025 | $2,020 | $121,840 | $24,000 | $97,840 |
| 2024 | $2,020 | $121,480 | $24,000 | $97,480 |
| 2023 | $1,383 | $103,480 | $20,000 | $83,480 |
| 2022 | $1,938 | $83,200 | $12,000 | $71,200 |
| 2021 | $1,945 | $68,200 | $12,000 | $56,200 |
| 2020 | $1,931 | $61,640 | $12,000 | $49,640 |
| 2019 | $1,930 | $61,640 | $12,000 | $49,640 |
| 2018 | $1,606 | $60,800 | $12,000 | $48,800 |
| 2017 | $1,612 | $55,320 | $12,000 | $43,320 |
| 2016 | $1,612 | $55,600 | $12,000 | $43,600 |
| 2015 | $1,640 | $56,200 | $12,000 | $44,200 |
| 2014 | $2,623 | $61,640 | $0 | $0 |
Seller's Agent in 2020
Christine Durrence
Keller Williams Coastal Area P
(912) 657-6174
37 Total Sales
Seller Co-Listing Agent in 2020
Butch Durrence
Keller Williams Coastal Area P
(912) 313-3846
Buyer's Agent in 2020
Jennifer Rabon
Next Move Real Estate LLC
(912) 667-3822
2 in this area
46 Total Sales