Estimated Value: $740,624 - $934,000
4
Beds
4
Baths
3,014
Sq Ft
$276/Sq Ft
Est. Value
About This Home
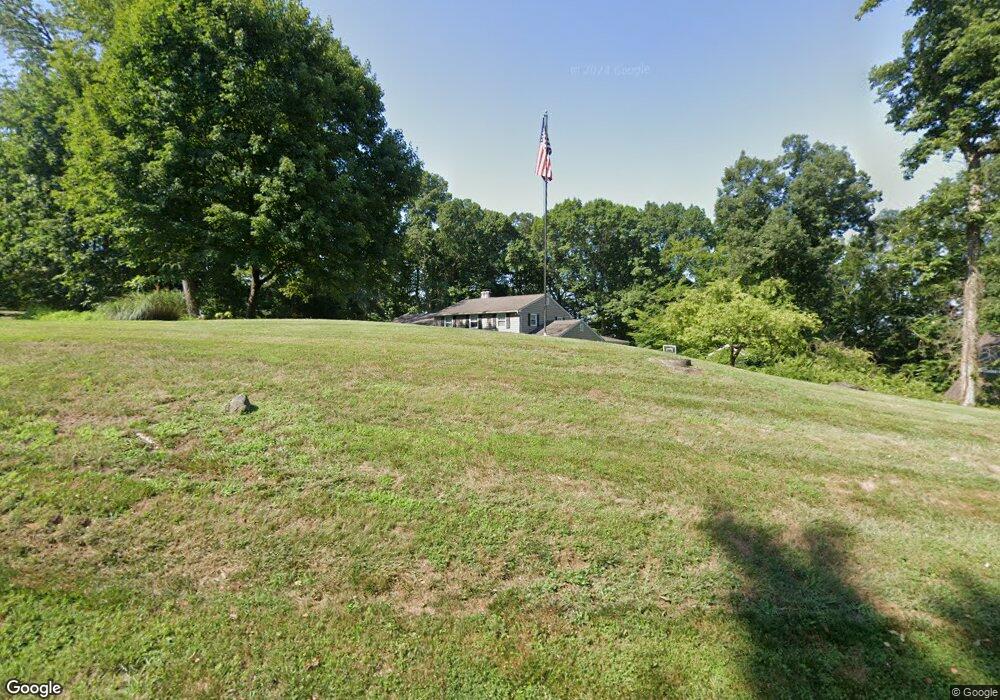
This home is located at 319 Ivy Ln, Glen Mills, PA 19342 and is currently estimated at $832,406, approximately $276 per square foot. 319 Ivy Ln is a home located in Delaware County with nearby schools including Garnet Valley High School and St. Thomas Apostle School.
Ownership History
Date
Name
Owned For
Owner Type
Purchase Details
Closed on
May 27, 2016
Sold by
Graham Stephen T and Graham Lisa A
Bought by
Graham Stephen T and Graham Lisa A
Current Estimated Value
Home Financials for this Owner
Home Financials are based on the most recent Mortgage that was taken out on this home.
Original Mortgage
$338,500
Outstanding Balance
$212,083
Interest Rate
3.66%
Mortgage Type
New Conventional
Estimated Equity
$620,323
Purchase Details
Closed on
Feb 5, 2008
Sold by
Gibbons Matthew J and Gibbons Jeannette M
Bought by
Graham Stephen T and Damico Lisa A
Home Financials for this Owner
Home Financials are based on the most recent Mortgage that was taken out on this home.
Original Mortgage
$384,000
Interest Rate
5.9%
Mortgage Type
Purchase Money Mortgage
Purchase Details
Closed on
Dec 2, 2000
Sold by
Swift Naomi H
Bought by
Gibbons Matthew J and Gibbons Jeannette M
Home Financials for this Owner
Home Financials are based on the most recent Mortgage that was taken out on this home.
Original Mortgage
$190,000
Interest Rate
7.7%
Create a Home Valuation Report for This Property
The Home Valuation Report is an in-depth analysis detailing your home's value as well as a comparison with similar homes in the area
Home Values in the Area
Average Home Value in this Area
Purchase History
| Date | Buyer | Sale Price | Title Company |
|---|---|---|---|
| Graham Stephen T | -- | Attorney | |
| Graham Stephen T | $480,000 | None Available | |
| Gibbons Matthew J | $300,000 | -- |
Source: Public Records
Mortgage History
| Date | Status | Borrower | Loan Amount |
|---|---|---|---|
| Open | Graham Stephen T | $338,500 | |
| Closed | Graham Stephen T | $384,000 | |
| Previous Owner | Gibbons Matthew J | $190,000 |
Source: Public Records
Tax History Compared to Growth
Tax History
| Year | Tax Paid | Tax Assessment Tax Assessment Total Assessment is a certain percentage of the fair market value that is determined by local assessors to be the total taxable value of land and additions on the property. | Land | Improvement |
|---|---|---|---|---|
| 2025 | $9,934 | $436,340 | $172,130 | $264,210 |
| 2024 | $9,934 | $436,340 | $172,130 | $264,210 |
| 2023 | $9,687 | $436,340 | $172,130 | $264,210 |
| 2022 | $9,580 | $436,340 | $172,130 | $264,210 |
| 2021 | $16,108 | $436,340 | $172,130 | $264,210 |
| 2020 | $8,160 | $206,510 | $62,630 | $143,880 |
| 2019 | $8,039 | $206,510 | $62,630 | $143,880 |
| 2018 | $7,916 | $206,510 | $0 | $0 |
| 2017 | $7,755 | $206,510 | $0 | $0 |
| 2016 | $1,133 | $206,510 | $0 | $0 |
| 2015 | $1,156 | $206,510 | $0 | $0 |
| 2014 | $1,133 | $206,510 | $0 | $0 |
Source: Public Records
Map
Nearby Homes
- 65 Pole Cat Rd
- 76 Dogwood Ln
- 244 Baltimore Pike Unit 313
- 244 Baltimore Pike Unit 101
- 244 Baltimore Pike Unit 108
- 21 Dougherty Blvd Unit S2
- 36 Eagle Ln Unit 18
- 5 Eagle Ln
- 9 Ivy Ln
- 116 Ivy Mills Rd
- 90 Bayberry Ct Unit 90
- 31 Ashley Ct Unit 31
- 65 Cheyney Rd
- 111 Cheyney Rd
- 325 Danbury Ct Unit 325
- 83 Bayberry Ct Unit 83
- 20 Highland Dr
- 23 Annesley Dr
- Lot 2 145 Governor Markham Cheslen
- 547 Concord Rd