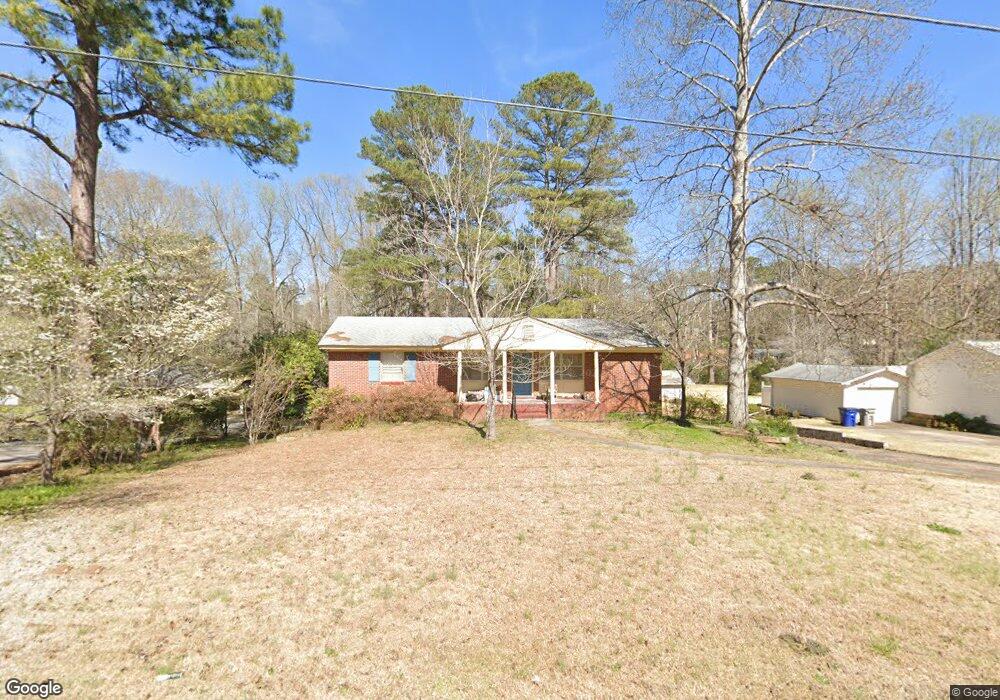
319 Laurel Ln Lagrange, GA 30241
Estimated Value: $180,000 - $200,000
3
Beds
2
Baths
1,250
Sq Ft
$151/Sq Ft
Est. Value
About This Home
This home is located at 319 Laurel Ln, Lagrange, GA 30241 and is currently estimated at $188,633, approximately $150 per square foot. 319 Laurel Ln is a home located in Troup County with nearby schools including Franklin Forest Elementary School, Hollis Hand Elementary School, and Ethel W. Kight Elementary School.
Ownership History
Date
Name
Owned For
Owner Type
Purchase Details
Closed on
Mar 5, 2024
Sold by
Cushman Kelly Joyce
Bought by
Cushman Trenton Michael
Current Estimated Value
Purchase Details
Closed on
Aug 8, 2012
Sold by
Striping Susan Cushman
Bought by
Striping Susan Cushman and Striping Cushman David
Purchase Details
Closed on
Sep 25, 1997
Sold by
Gerald D Cushman By Ex
Bought by
Cushman Evelyn R
Purchase Details
Closed on
Jan 7, 1983
Sold by
Ann Nixon Moseley
Bought by
Gerald D Cushman By Ex
Purchase Details
Closed on
Oct 1, 1981
Sold by
Lawrence R Moseley
Bought by
Ann Nixon Moseley
Purchase Details
Closed on
Aug 28, 1980
Sold by
Ann S Nixon
Bought by
Lawrence R Moseley
Purchase Details
Closed on
Oct 27, 1979
Sold by
Walter Mcgee
Bought by
Ann S Nixon
Purchase Details
Closed on
Jan 1, 1966
Bought by
Walter Mcgee
Create a Home Valuation Report for This Property
The Home Valuation Report is an in-depth analysis detailing your home's value as well as a comparison with similar homes in the area
Purchase History
We collect this data history from publicly available records. To have your information removed, we recommend requesting removal directly through your county’s website.
| Date | Buyer | Sale Price | Title Company |
|---|---|---|---|
| Cushman Trenton Michael | -- | -- | |
| Striping Susan Cushman | -- | -- | |
| Cushman Evelyn R | -- | -- | |
| Gerald D Cushman By Ex | -- | -- | |
| Ann Nixon Moseley | -- | -- | |
| Lawrence R Moseley | -- | -- | |
| Ann S Nixon | -- | -- | |
| Walter Mcgee | -- | -- |
Source: Public Records
Tax History
| Year | Tax Paid | Tax Assessment Tax Assessment Total Assessment is a certain percentage of the fair market value that is determined by local assessors to be the total taxable value of land and additions on the property. | Land | Improvement |
|---|---|---|---|---|
| 2025 | $1,841 | $72,444 | $10,000 | $62,444 |
| 2024 | $1,750 | $64,156 | $10,000 | $54,156 |
| 2023 | $1,487 | $56,500 | $10,000 | $46,500 |
| 2022 | $1,470 | $54,660 | $10,000 | $44,660 |
| 2021 | $1,188 | $41,384 | $8,000 | $33,384 |
| 2020 | $1,188 | $41,384 | $8,000 | $33,384 |
| 2019 | $1,062 | $37,208 | $7,440 | $29,768 |
| 2018 | $1,019 | $35,788 | $7,440 | $28,348 |
| 2017 | $876 | $31,018 | $3,990 | $27,028 |
| 2016 | $850 | $30,179 | $3,990 | $26,189 |
| 2015 | $912 | $30,201 | $4,948 | $25,253 |
| 2014 | $874 | $28,872 | $4,948 | $23,924 |
| 2013 | -- | $29,850 | $4,948 | $24,902 |
Source: Public Records
Map
Nearby Homes
- 324 Park Hill Dr
- 105 Dogwood Dr
- 172 Merrybrook Dr
- 202 Park Hill Dr
- 133 Alton Dr
- 806 New Franklin Rd
- 124 Melrose Dr
- 120 North St
- 900 North St
- 226 Hearthstone Dr
- 110 Russell St
- 706 N Harlem Cir
- 115 Daniel Ct
- 131 Foch St
- 219 Banks St
- 134 S Page St
- 179 Youngs Mill Rd
- 301 E Bacon St
- 0 Ridley Ave Unit 10550104
- 725 N Greenwood St
- 321 Laurel Ln
- 326 Laurel Ln
- 322 Laurel Ln
- 317 Laurel Ln
- 318 Laurel Ln
- 311 Laurel Ln
- 330 Laurel Ln
- 314 Laurel Ln
- 315 Park Hill Dr
- 319 Park Hill Dr
- 334 Laurel Ln
- 309 Laurel Ln
- 331 Laurel Ln
- 310 Laurel Ln
- 311 Park Hill Dr
- 307 Park Hill Dr
- 107 Starmount Dr
- 323 Park Hill Dr
- 323 Park Hill Dr Unit 27
- 306 Laurel Ln
Your Personal Tour Guide
Ask me questions while you tour the home.