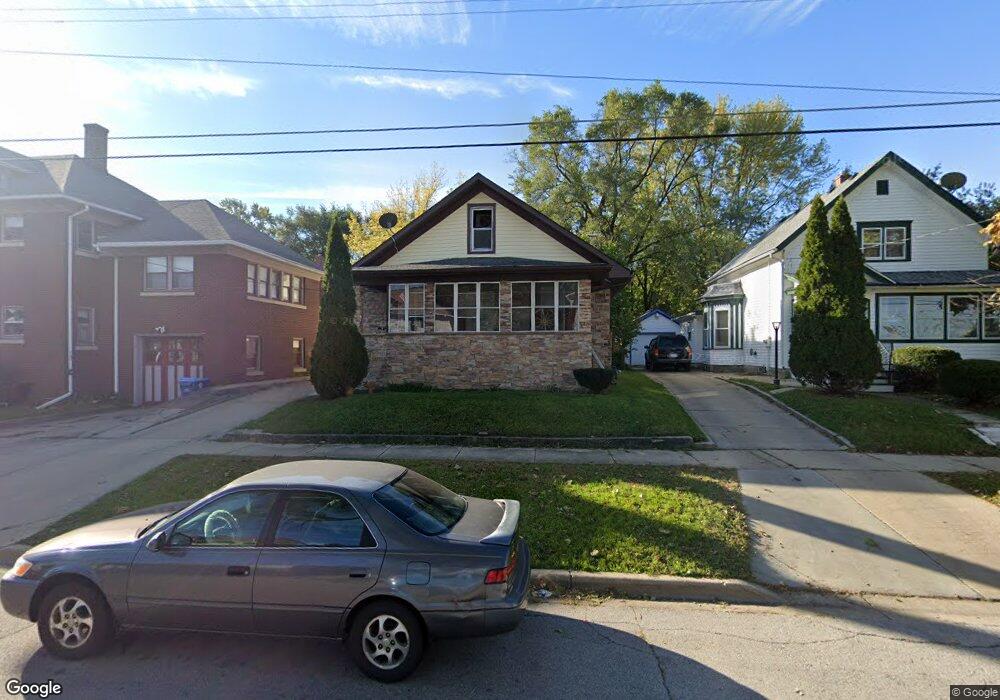
319 Liberty St Aurora, IL 60505
McCarty Burlington NeighborhoodEstimated Value: $214,000 - $245,000
3
Beds
1
Bath
1,232
Sq Ft
$188/Sq Ft
Est. Value
About This Home
This home is located at 319 Liberty St, Aurora, IL 60505 and is currently estimated at $231,234, approximately $187 per square foot. 319 Liberty St is a home located in Kane County with nearby schools including Brady Elementary School, Simmons Middle School, and East Aurora High School.
Ownership History
Date
Name
Owned For
Owner Type
Purchase Details
Closed on
May 28, 2004
Sold by
Regional Investments Llc
Bought by
Deltoro Manuel
Current Estimated Value
Home Financials for this Owner
Home Financials are based on the most recent Mortgage that was taken out on this home.
Original Mortgage
$123,779
Outstanding Balance
$60,751
Interest Rate
6.06%
Mortgage Type
FHA
Estimated Equity
$170,483
Purchase Details
Closed on
Oct 1, 2002
Sold by
Capital Securities Inc
Bought by
Regional Investment Llc
Home Financials for this Owner
Home Financials are based on the most recent Mortgage that was taken out on this home.
Original Mortgage
$102,063
Interest Rate
7%
Purchase Details
Closed on
May 20, 2002
Sold by
Theisen Beatrice C
Bought by
Capital Securities Inc
Home Financials for this Owner
Home Financials are based on the most recent Mortgage that was taken out on this home.
Original Mortgage
$189,000
Interest Rate
4.75%
Create a Home Valuation Report for This Property
The Home Valuation Report is an in-depth analysis detailing your home's value as well as a comparison with similar homes in the area
Home Values in the Area
Average Home Value in this Area
Purchase History
| Date | Buyer | Sale Price | Title Company |
|---|---|---|---|
| Deltoro Manuel | $125,000 | First American Title | |
| Regional Investment Llc | $103,500 | Law Title Insurance Co Inc | |
| Capital Securities Inc | $95,000 | Chicago Title Insurance Co |
Source: Public Records
Mortgage History
| Date | Status | Borrower | Loan Amount |
|---|---|---|---|
| Open | Deltoro Manuel | $123,779 | |
| Previous Owner | Regional Investment Llc | $102,063 | |
| Previous Owner | Capital Securities Inc | $189,000 |
Source: Public Records
Tax History Compared to Growth
Tax History
| Year | Tax Paid | Tax Assessment Tax Assessment Total Assessment is a certain percentage of the fair market value that is determined by local assessors to be the total taxable value of land and additions on the property. | Land | Improvement |
|---|---|---|---|---|
| 2024 | $2,756 | $48,197 | $5,085 | $43,112 |
| 2023 | $2,620 | $43,063 | $4,543 | $38,520 |
| 2022 | $2,830 | $43,241 | $4,145 | $39,096 |
| 2021 | $2,766 | $40,258 | $3,859 | $36,399 |
| 2020 | $2,611 | $37,393 | $3,584 | $33,809 |
| 2019 | $2,603 | $35,535 | $3,321 | $32,214 |
| 2018 | $2,074 | $28,777 | $3,072 | $25,705 |
| 2017 | $1,962 | $26,006 | $2,831 | $23,175 |
| 2016 | $1,775 | $22,863 | $2,427 | $20,436 |
| 2015 | -- | $20,377 | $2,087 | $18,290 |
| 2014 | -- | $19,272 | $1,918 | $17,354 |
| 2013 | -- | $20,495 | $1,833 | $18,662 |
Source: Public Records
Map
Nearby Homes
- 608 Front St
- 574 E Galena Blvd
- 172 N East Ave
- 226 N Ohio St
- 222 Grand Ave
- 168 S Lincoln Ave
- 438 North Ave
- 1038 Liberty St
- 256 W Downer Place
- 312 S Spencer St
- 773 Aurora Ave
- 332 North Ave
- 644 Oak Ave
- 1111 Liberty St
- 440 Center Ave
- 415 Blackhawk St
- 949 E Benton St
- 466 Hinman St
- 450 W Downer Place Unit 4C
- 550 5th Ave