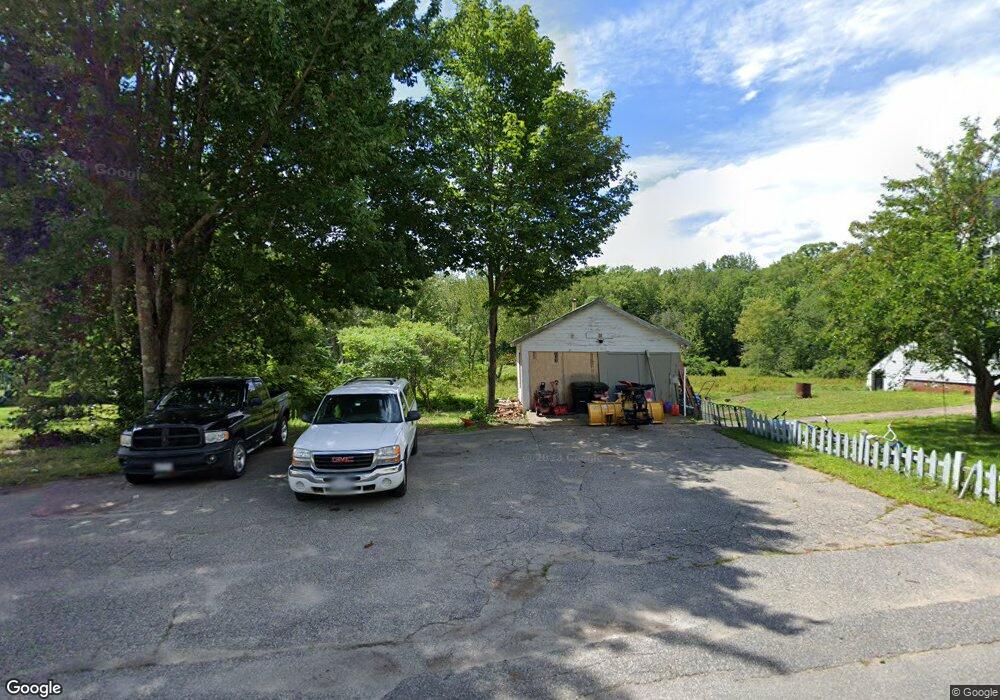
319 Main St Springvale, ME 04083
Estimated Value: $189,000 - $352,000
3
Beds
2
Baths
1,891
Sq Ft
$134/Sq Ft
Est. Value
About This Home
This home is located at 319 Main St, Springvale, ME 04083 and is currently estimated at $254,280, approximately $134 per square foot. 319 Main St is a home located in York County with nearby schools including St Thomas Consolidated School and Sanford Christian Academy.
Ownership History
Date
Name
Owned For
Owner Type
Purchase Details
Closed on
Aug 25, 2025
Sold by
Parach Llc
Bought by
Q & C Realty Group Llc
Current Estimated Value
Home Financials for this Owner
Home Financials are based on the most recent Mortgage that was taken out on this home.
Original Mortgage
$194,000
Outstanding Balance
$193,496
Interest Rate
6.75%
Mortgage Type
New Conventional
Estimated Equity
$60,784
Purchase Details
Closed on
Jul 1, 2025
Sold by
Gardner Nancy D
Bought by
Parach Llc
Home Financials for this Owner
Home Financials are based on the most recent Mortgage that was taken out on this home.
Original Mortgage
$194,000
Outstanding Balance
$193,496
Interest Rate
6.75%
Mortgage Type
New Conventional
Estimated Equity
$60,784
Create a Home Valuation Report for This Property
The Home Valuation Report is an in-depth analysis detailing your home's value as well as a comparison with similar homes in the area
Home Values in the Area
Average Home Value in this Area
Purchase History
| Date | Buyer | Sale Price | Title Company |
|---|---|---|---|
| Q & C Realty Group Llc | $200,000 | -- | |
| Q & C Realty Group Llc | $200,000 | -- | |
| Q & C Realty Group Llc | $200,000 | -- | |
| Parach Llc | $160,000 | -- | |
| Parach Llc | $160,000 | -- | |
| Parach Llc | $160,000 | -- |
Source: Public Records
Mortgage History
| Date | Status | Borrower | Loan Amount |
|---|---|---|---|
| Open | Q & C Realty Group Llc | $194,000 | |
| Closed | Q & C Realty Group Llc | $194,000 |
Source: Public Records
Tax History
| Year | Tax Paid | Tax Assessment Tax Assessment Total Assessment is a certain percentage of the fair market value that is determined by local assessors to be the total taxable value of land and additions on the property. | Land | Improvement |
|---|---|---|---|---|
| 2025 | $3,572 | $208,900 | $47,500 | $161,400 |
| 2024 | $3,372 | $208,900 | $47,500 | $161,400 |
| 2023 | $3,140 | $207,400 | $47,500 | $159,900 |
| 2022 | $3,070 | $207,400 | $47,500 | $159,900 |
| 2021 | $3,309 | $182,000 | $47,500 | $134,500 |
| 2020 | $3,371 | $167,200 | $47,500 | $119,700 |
| 2019 | $3,113 | $150,400 | $47,500 | $102,900 |
| 2018 | $3,059 | $149,200 | $47,500 | $101,700 |
| 2017 | $2,958 | $142,600 | $47,500 | $95,100 |
| 2016 | $3,024 | $133,000 | $47,500 | $85,500 |
| 2015 | $2,826 | $138,200 | $57,000 | $81,200 |
| 2014 | $2,819 | $140,400 | $59,200 | $81,200 |
| 2013 | -- | $140,400 | $59,200 | $81,200 |
Source: Public Records
Map
Nearby Homes
- 17 Deering Neighborhood Rd
- 2 Kirk St
- 2 Harrison St
- 446 Main St
- 5 Goodwin St
- 39 Payne St
- 36 Littlefield Rd
- 6 Harris St
- 14 Pleasant St
- 3 George St
- 14 Webster St
- 5 Allenson St
- 12 Harrison Ave
- 538 Main St Unit 2
- 2 Libby Ln
- TBD Elm St
- 6 Windy Ridge Ln
- 19 Rosewood Cir
- 6 Signal St Unit 6
- 17 Signal St Unit I-1