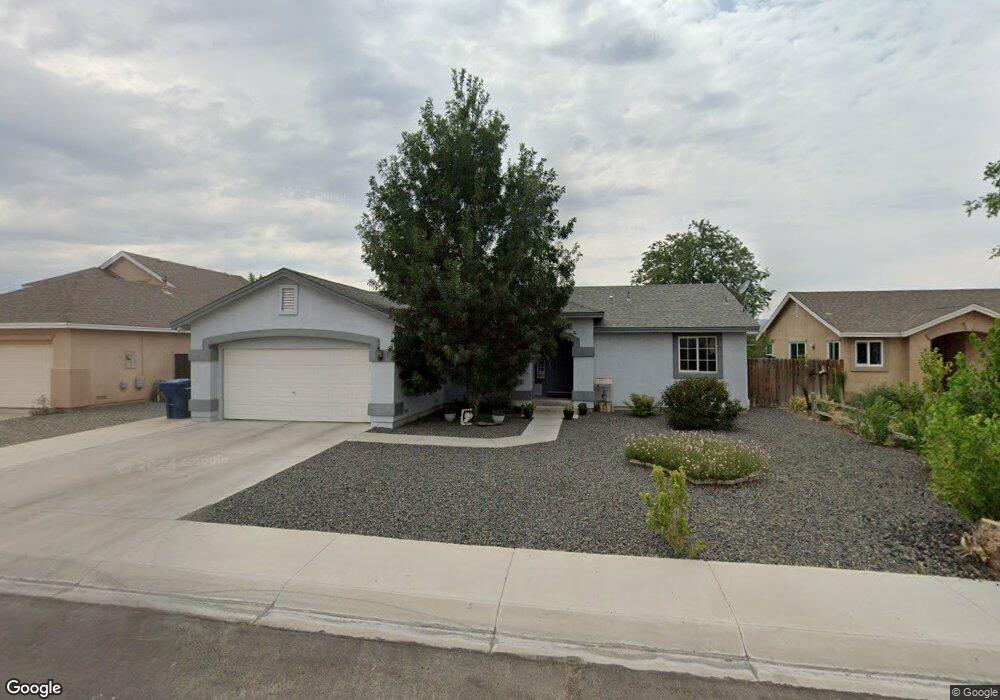
319 Marshall St Unit 2 Fernley, NV 89408
Estimated Value: $275,000 - $356,000
3
Beds
2
Baths
1,416
Sq Ft
$235/Sq Ft
Est. Value
About This Home
This home is located at 319 Marshall St Unit 2, Fernley, NV 89408 and is currently estimated at $333,387, approximately $235 per square foot. 319 Marshall St Unit 2 is a home located in Lyon County with nearby schools including Fernley Elementary School, Fernley Intermediate School, and Fernley High School.
Ownership History
Date
Name
Owned For
Owner Type
Purchase Details
Closed on
Nov 7, 2013
Sold by
Baldree Kimberly Anne
Bought by
Baldree Robert Louis
Current Estimated Value
Purchase Details
Closed on
Aug 10, 2011
Sold by
Federal National Mortgage Association
Bought by
Baldree Robert Louis and Baldree Kimberly Anne
Purchase Details
Closed on
May 19, 2011
Sold by
Olsen Lori S
Bought by
Federal National Mortgage Association
Purchase Details
Closed on
Mar 16, 2005
Sold by
Marlow Alan and Wood Donald R
Bought by
Olsen Lori S
Home Financials for this Owner
Home Financials are based on the most recent Mortgage that was taken out on this home.
Original Mortgage
$168,000
Interest Rate
5.9%
Mortgage Type
Adjustable Rate Mortgage/ARM
Create a Home Valuation Report for This Property
The Home Valuation Report is an in-depth analysis detailing your home's value as well as a comparison with similar homes in the area
Home Values in the Area
Average Home Value in this Area
Purchase History
| Date | Buyer | Sale Price | Title Company |
|---|---|---|---|
| Baldree Robert Louis | -- | None Available | |
| Baldree Robert Louis | $65,900 | Ticor Title Of Nevada | |
| Federal National Mortgage Association | $227,222 | First American Title Default | |
| Olsen Lori S | $210,000 | First Centennial Tilte Co Nv | |
| Wood Pete E | -- | First Centennial Title Co Nv |
Source: Public Records
Mortgage History
| Date | Status | Borrower | Loan Amount |
|---|---|---|---|
| Previous Owner | Olsen Lori S | $168,000 |
Source: Public Records
Tax History Compared to Growth
Tax History
| Year | Tax Paid | Tax Assessment Tax Assessment Total Assessment is a certain percentage of the fair market value that is determined by local assessors to be the total taxable value of land and additions on the property. | Land | Improvement |
|---|---|---|---|---|
| 2025 | $1,713 | $93,665 | $43,750 | $49,915 |
| 2024 | $2,072 | $94,160 | $43,750 | $50,410 |
| 2023 | $2,072 | $84,189 | $36,750 | $47,439 |
| 2022 | $1,889 | $80,647 | $36,750 | $43,897 |
| 2021 | $1,805 | $69,201 | $26,250 | $42,951 |
| 2020 | $1,699 | $67,492 | $26,250 | $41,242 |
| 2019 | $1,636 | $66,268 | $26,250 | $40,018 |
| 2018 | $1,582 | $58,003 | $18,900 | $39,103 |
| 2017 | $1,568 | $47,604 | $8,400 | $39,204 |
| 2016 | $1,384 | $39,983 | $5,780 | $34,203 |
| 2015 | $1,419 | $32,522 | $5,780 | $26,742 |
| 2014 | $1,387 | $27,258 | $5,780 | $21,478 |
Source: Public Records
Map
Nearby Homes
- 321 Marshall St
- 317 Marshall St
- 315 Marshall St
- 318 Marshall St
- 316 Marshall St
- 323 Marshall St Unit 2
- 320 Marshall St
- 313 Marshall St
- 314 Marshall St
- 110 Rachel St
- 312 Marshall St
- 311 Marshall St
- 209 Jason Ct
- 207 Jason Ct
- 108 Rachel St
- 310 Marshall St
- 106 Rachel St Unit 1
- 309 Marshall St
- 419 Sunshine Ln
- 417 Sunshine Ln