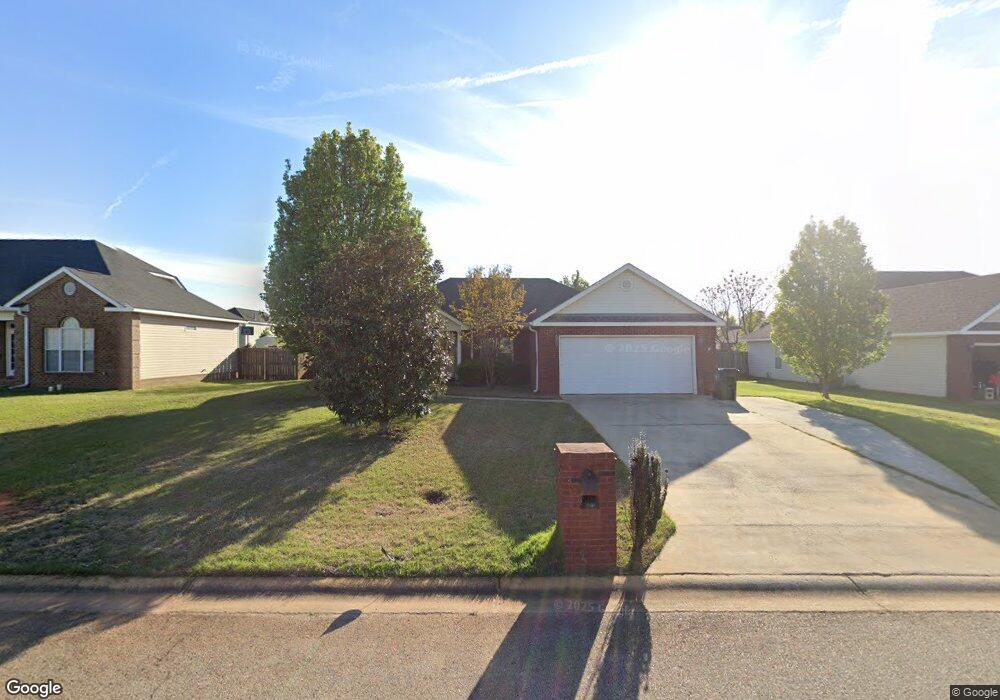
319 Minter Dr Warner Robins, GA 31088
Estimated Value: $236,000 - $266,789
Studio
--
Bath
1,520
Sq Ft
$164/Sq Ft
Est. Value
About This Home
This home is located at 319 Minter Dr, Warner Robins, GA 31088 and is currently estimated at $249,447, approximately $164 per square foot. 319 Minter Dr is a home located in Houston County with nearby schools including David A. Perdue Primary School, David A. Perdue Elementary School, and Feagin Mill Middle School.
Ownership History
Date
Name
Owned For
Owner Type
Purchase Details
Closed on
Feb 20, 2008
Sold by
Cromwell Lamar E and Cromwell Da Vonna S
Bought by
Million Kari
Current Estimated Value
Home Financials for this Owner
Home Financials are based on the most recent Mortgage that was taken out on this home.
Original Mortgage
$126,100
Outstanding Balance
$76,842
Interest Rate
5.85%
Mortgage Type
Purchase Money Mortgage
Estimated Equity
$172,605
Purchase Details
Closed on
Jun 30, 2004
Sold by
Cromwell Lamar E
Bought by
Cromwell Lamar E and Cromwell Da-Vonna S
Purchase Details
Closed on
Jan 17, 2004
Bought by
D & M Construction Llp
Purchase Details
Closed on
Jan 16, 2004
Sold by
D & M Construction Llp
Bought by
Miles Edgar D
Purchase Details
Closed on
Jul 1, 2003
Sold by
Leclay Inc
Bought by
D & M Construction Llp
Create a Home Valuation Report for This Property
The Home Valuation Report is an in-depth analysis detailing your home's value as well as a comparison with similar homes in the area
Home Values in the Area
Average Home Value in this Area
Purchase History
| Date | Buyer | Sale Price | Title Company |
|---|---|---|---|
| Million Kari | $130,000 | None Available | |
| Cromwell Lamar E | -- | -- | |
| Cromwell Lamar E | $125,600 | -- | |
| D & M Construction Llp | -- | -- | |
| Miles Edgar D | -- | -- | |
| D & M Construction Llp | $17,500 | -- |
Source: Public Records
Mortgage History
| Date | Status | Borrower | Loan Amount |
|---|---|---|---|
| Open | Million Kari | $126,100 |
Source: Public Records
Tax History
| Year | Tax Paid | Tax Assessment Tax Assessment Total Assessment is a certain percentage of the fair market value that is determined by local assessors to be the total taxable value of land and additions on the property. | Land | Improvement |
|---|---|---|---|---|
| 2025 | $2,534 | $92,160 | $10,000 | $82,160 |
| 2024 | $2,764 | $85,840 | $10,000 | $75,840 |
| 2023 | $2,622 | $80,920 | $10,000 | $70,920 |
| 2022 | $1,523 | $68,240 | $9,200 | $59,040 |
| 2021 | $1,370 | $61,280 | $9,200 | $52,080 |
| 2020 | $1,259 | $56,200 | $8,800 | $47,400 |
| 2019 | $1,259 | $56,200 | $8,800 | $47,400 |
| 2018 | $1,180 | $52,800 | $8,800 | $44,000 |
| 2017 | $1,181 | $52,800 | $8,800 | $44,000 |
| 2016 | $1,183 | $52,800 | $8,800 | $44,000 |
| 2015 | -- | $52,800 | $8,800 | $44,000 |
| 2014 | $527 | $52,800 | $8,800 | $44,000 |
| 2013 | $527 | $52,800 | $8,800 | $44,000 |
Source: Public Records
Map
Nearby Homes
- 404 Minter Dr
- 108 Holbeck Ct
- 305 Carver Ct
- 307 Carver Ct
- 401 Bella Notte Cir Unit 5D
- 401 Bella Notte Cir
- 301 Meyers Lake Dr
- 414 Bella Notte Cir
- 414 Bella Notte Cir Unit 23A
- 409 Bella Notte Cir Unit 1D
- 409 Bella Notte Cir
- 416 Bella Notte Cir
- 502 Bella Notte Cir
- 502 Bella Notte Cir Unit 15A
- 500 Bella Notte Cir Unit 16A
- 500 Bella Notte Cir
- 213 Air Park Dr
- 316 Haverhill Cir
- 113 Jana Ct
- 0 Feagin Mill Rd Unit 10572748
Your Personal Tour Guide
Ask me questions while you tour the home.