Estimated Value: $170,000 - $207,564
3
Beds
2
Baths
1,140
Sq Ft
$164/Sq Ft
Est. Value
About This Home
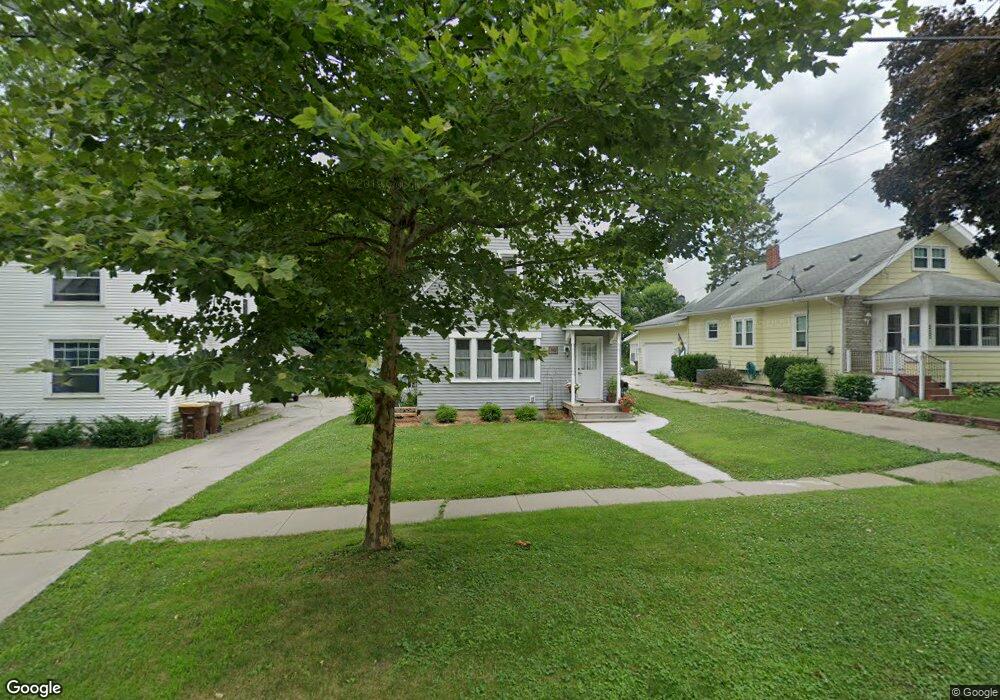
This home is located at 319 Morse St Unit 201 IONIA CITY, Ionia, MI 48846 and is currently estimated at $187,391, approximately $164 per square foot. 319 Morse St Unit 201 IONIA CITY is a home located in Ionia County with nearby schools including Ionia High School, Saints Peter and Paul Catholic School, and Ionia Seventh Day Adventist Elementary School.
Ownership History
Date
Name
Owned For
Owner Type
Purchase Details
Closed on
Oct 21, 2022
Sold by
Bollinger Connie
Bought by
Lundie Melissa
Current Estimated Value
Home Financials for this Owner
Home Financials are based on the most recent Mortgage that was taken out on this home.
Original Mortgage
$177,156
Outstanding Balance
$171,432
Interest Rate
6.9%
Mortgage Type
Construction
Estimated Equity
$15,959
Purchase Details
Closed on
May 10, 2021
Sold by
Wall and Thomas
Bought by
Bollinger Connie
Create a Home Valuation Report for This Property
The Home Valuation Report is an in-depth analysis detailing your home's value as well as a comparison with similar homes in the area
Home Values in the Area
Average Home Value in this Area
Purchase History
| Date | Buyer | Sale Price | Title Company |
|---|---|---|---|
| Lundie Melissa | $171,000 | -- | |
| Bollinger Connie | $162,000 | -- |
Source: Public Records
Mortgage History
| Date | Status | Borrower | Loan Amount |
|---|---|---|---|
| Open | Lundie Melissa | $177,156 |
Source: Public Records
Tax History Compared to Growth
Tax History
| Year | Tax Paid | Tax Assessment Tax Assessment Total Assessment is a certain percentage of the fair market value that is determined by local assessors to be the total taxable value of land and additions on the property. | Land | Improvement |
|---|---|---|---|---|
| 2025 | $3,117 | $86,400 | $11,800 | $74,600 |
| 2024 | $2,900 | $86,400 | $11,800 | $74,600 |
| 2023 | $2,767 | $61,300 | $8,700 | $52,600 |
| 2022 | $2,232 | $55,000 | $7,600 | $47,400 |
| 2021 | $1,863 | $45,800 | $7,600 | $38,200 |
| 2020 | $1,713 | $45,800 | $7,600 | $38,200 |
| 2019 | $923 | $47,000 | $6,300 | $40,700 |
| 2018 | $1,784 | $42,700 | $5,600 | $37,100 |
| 2017 | $1,415 | $42,700 | $5,600 | $37,100 |
| 2016 | $923 | $28,500 | $5,000 | $23,500 |
| 2015 | -- | $28,500 | $5,000 | $23,500 |
| 2014 | $922 | $27,100 | $6,200 | $20,900 |
Source: Public Records
Map
Nearby Homes
- 342 Pearl St
- 533 E Washington St Unit A,B,C,D
- 22 Wager Place
- 422 Johnson St
- 615 & 625 E Lincoln Ave
- 514 N Jefferson St
- 418 Jones St
- 148 Mill St
- 526 N Jackson St
- 120 S Jackson St
- 260 E Main St
- 237 E Lincoln Ave
- 818 E Main St
- 709 Skyview Trail
- Integrity 1530 Plan at Timber Ridge - Integrity
- Integrity 2061 V8.1a Plan at Timber Ridge - Integrity
- Integrity 1605 Plan at Timber Ridge - Integrity
- Integrity 1560 Plan at Timber Ridge - Integrity
- Integrity 1830 Plan at Timber Ridge - Integrity
- Integrity 1520 Plan at Timber Ridge - Integrity