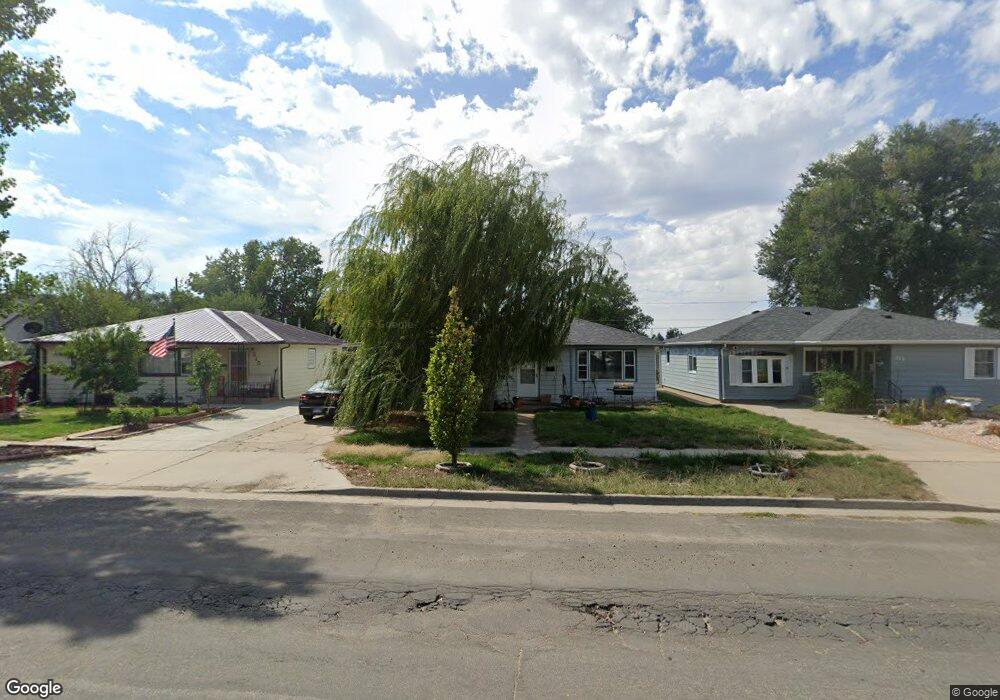
319 N 7th Ave Sterling, CO 80751
Estimated Value: $189,990 - $237,000
4
Beds
1
Bath
1,558
Sq Ft
$132/Sq Ft
Est. Value
About This Home
This home is located at 319 N 7th Ave, Sterling, CO 80751 and is currently estimated at $206,248, approximately $132 per square foot. 319 N 7th Ave is a home located in Logan County with nearby schools including Campbell Elementary School, Ayres Elementary School, and Sterling Middle School.
Ownership History
Date
Name
Owned For
Owner Type
Purchase Details
Closed on
Sep 11, 2009
Sold by
Dekruif Rodney J
Bought by
Fischer Kimberly A and Huey Toby L
Current Estimated Value
Home Financials for this Owner
Home Financials are based on the most recent Mortgage that was taken out on this home.
Original Mortgage
$96,900
Outstanding Balance
$62,563
Interest Rate
5.26%
Mortgage Type
New Conventional
Estimated Equity
$143,685
Purchase Details
Closed on
Jun 6, 2008
Sold by
Dekruif Rodney J and Dekruif Sharon L
Bought by
Dekruif Rodney J
Purchase Details
Closed on
Oct 23, 2007
Sold by
U S Bank National Association
Bought by
Dekruif Rodney J and Dekruif Sharon L
Home Financials for this Owner
Home Financials are based on the most recent Mortgage that was taken out on this home.
Original Mortgage
$61,000
Interest Rate
6.32%
Mortgage Type
New Conventional
Purchase Details
Closed on
Jun 19, 2007
Sold by
Moreno Kari L
Bought by
U S Bank National Association
Create a Home Valuation Report for This Property
The Home Valuation Report is an in-depth analysis detailing your home's value as well as a comparison with similar homes in the area
Purchase History
| Date | Buyer | Sale Price | Title Company |
|---|---|---|---|
| Fischer Kimberly A | $95,000 | Stewart Title | |
| Dekruif Rodney J | -- | None Available | |
| Dekruif Rodney J | $77,000 | None Available | |
| U S Bank National Association | -- | None Available |
Source: Public Records
Mortgage History
| Date | Status | Borrower | Loan Amount |
|---|---|---|---|
| Open | Fischer Kimberly A | $96,900 | |
| Previous Owner | Dekruif Rodney J | $61,000 |
Source: Public Records
Tax History
| Year | Tax Paid | Tax Assessment Tax Assessment Total Assessment is a certain percentage of the fair market value that is determined by local assessors to be the total taxable value of land and additions on the property. | Land | Improvement |
|---|---|---|---|---|
| 2025 | $1,076 | $12,836 | $0 | $0 |
| 2024 | $618 | $11,790 | $0 | $0 |
| 2023 | $618 | $11,790 | $0 | $0 |
| 2022 | $783 | $9,290 | $900 | $8,390 |
| 2021 | $765 | $9,560 | $930 | $8,630 |
| 2020 | $681 | $16,180 | $750 | $15,430 |
| 2019 | $679 | $16,060 | $740 | $15,320 |
| 2018 | $611 | $7,210 | $660 | $6,550 |
| 2017 | $601 | $35,050 | $3,190 | $31,860 |
| 2015 | $581 | $31,780 | $2,960 | $28,820 |
| 2014 | $581 | $29,480 | $2,960 | $26,520 |
| 2013 | $581 | $29,480 | $2,960 | $26,520 |
Source: Public Records
Map
Nearby Homes
Your Personal Tour Guide
Ask me questions while you tour the home.