Studio
--
Bath
3,200
Sq Ft
6,534
Sq Ft Lot
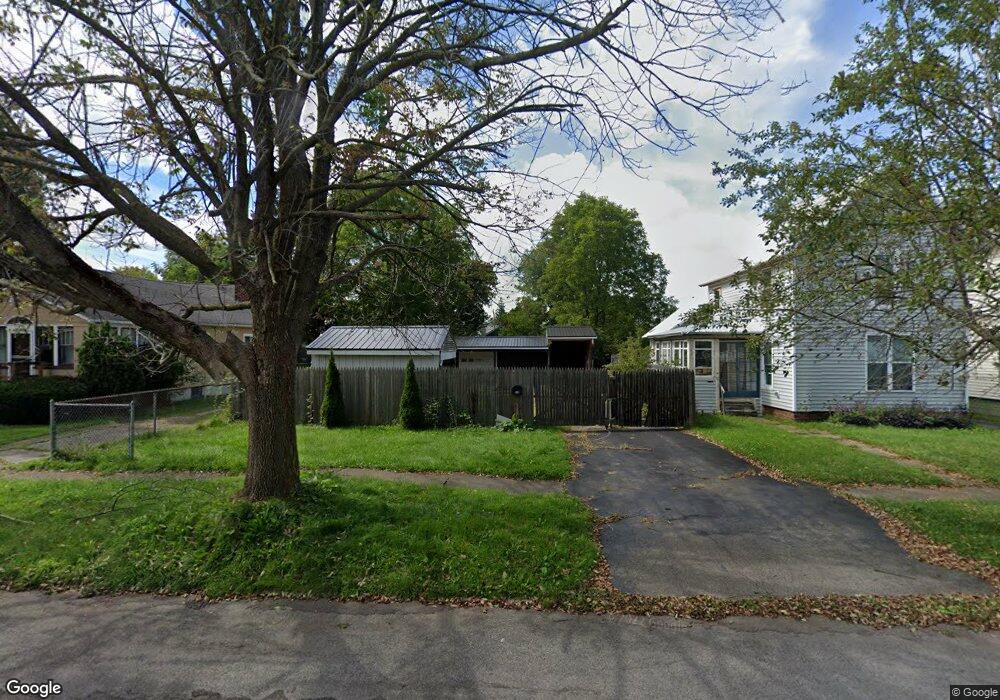
About This Home
This home is located at 319 N 8th St, Olean, NY 14760. 319 N 8th St is a home located in Cattaraugus County with nearby schools including Olean Intermediate-Middle School, Olean Senior High School, and Southern Tier Catholic School.
Ownership History
Date
Name
Owned For
Owner Type
Purchase Details
Closed on
Jun 8, 2022
Sold by
Cattaraugus County Of
Bought by
Pawlak Jai
Purchase Details
Closed on
Apr 29, 2022
Sold by
Bean John F
Bought by
Cattaraugus County Of
Purchase Details
Closed on
Apr 4, 2014
Sold by
Bean Jr. John R
Bought by
Bean John F
Home Financials for this Owner
Home Financials are based on the most recent Mortgage that was taken out on this home.
Original Mortgage
$25,000
Interest Rate
3.38%
Mortgage Type
Commercial
Purchase Details
Closed on
Oct 13, 1999
Sold by
Bean Charles R and Bean John R
Bought by
Bean John R
Create a Home Valuation Report for This Property
The Home Valuation Report is an in-depth analysis detailing your home's value as well as a comparison with similar homes in the area
Home Values in the Area
Average Home Value in this Area
Purchase History
| Date | Buyer | Sale Price | Title Company |
|---|---|---|---|
| Pawlak Jai | $18,000 | None Available | |
| Pawlak Jai | $18,000 | None Available | |
| Cattaraugus County Of | -- | None Available | |
| Bean John F | $28,500 | Nicholas Dicerbo, Jr. | |
| Bean John F | $28,500 | Nicholas Dicerbo, Jr. | |
| Bean John R | $15,000 | J Michael Shane | |
| Bean John R | $15,000 | J Michael Shane |
Source: Public Records
Mortgage History
| Date | Status | Borrower | Loan Amount |
|---|---|---|---|
| Previous Owner | Bean John F | $25,000 |
Source: Public Records
Tax History
| Year | Tax Paid | Tax Assessment Tax Assessment Total Assessment is a certain percentage of the fair market value that is determined by local assessors to be the total taxable value of land and additions on the property. | Land | Improvement |
|---|---|---|---|---|
| 2025 | $1,897 | $30,000 | $3,000 | $27,000 |
| 2024 | $1,897 | $30,000 | $3,000 | $27,000 |
| 2023 | $1,129 | $30,000 | $3,000 | $27,000 |
| 2022 | $1,146 | $30,000 | $3,000 | $27,000 |
| 2021 | $1,179 | $30,000 | $3,000 | $27,000 |
| 2020 | $3,289 | $30,000 | $3,000 | $27,000 |
| 2019 | $1,104 | $30,000 | $3,000 | $27,000 |
| 2018 | $4,584 | $30,000 | $3,000 | $27,000 |
| 2017 | $3,029 | $30,000 | $3,000 | $27,000 |
| 2016 | $1,775 | $17,000 | $3,000 | $14,000 |
| 2015 | -- | $17,000 | $3,000 | $14,000 |
| 2014 | -- | $17,000 | $3,000 | $14,000 |
Source: Public Records
Map
Nearby Homes
Your Personal Tour Guide
Ask me questions while you tour the home.