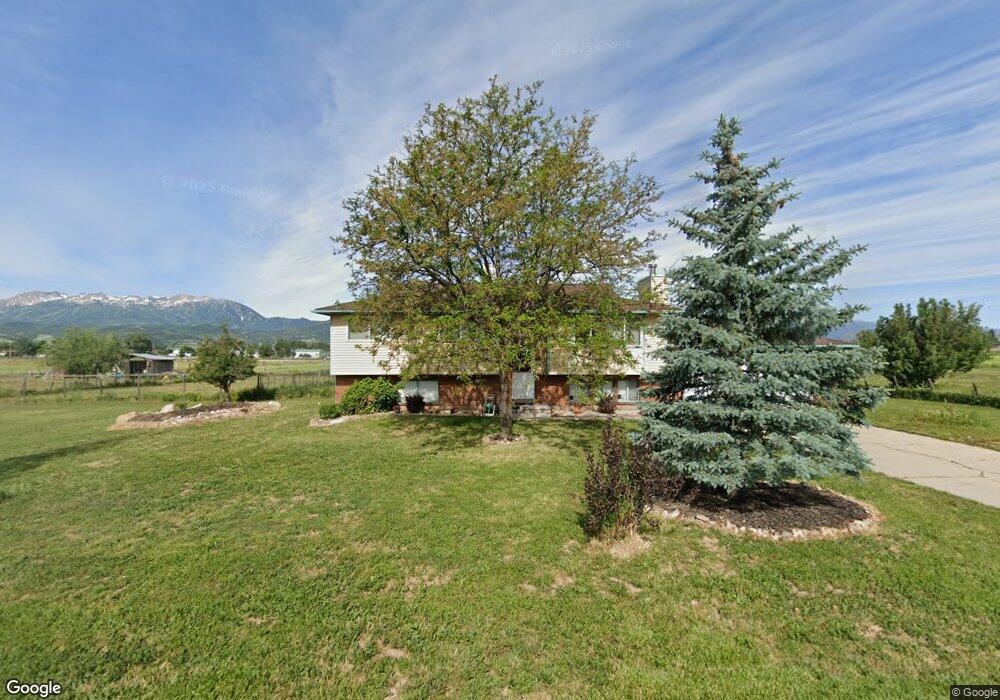
319 N 9000 E Huntsville, UT 84317
Estimated Value: $743,581 - $913,000
5
Beds
3
Baths
2,405
Sq Ft
$339/Sq Ft
Est. Value
About This Home
This home is located at 319 N 9000 E, Huntsville, UT 84317 and is currently estimated at $815,145, approximately $338 per square foot. 319 N 9000 E is a home located in Weber County with nearby schools including Valley Elementary School, Snowcrest Junior High School, and Weber High School.
Ownership History
Date
Name
Owned For
Owner Type
Purchase Details
Closed on
Aug 23, 2021
Sold by
Harris Mary Anne R
Bought by
Roberts Harris Maryanne
Current Estimated Value
Home Financials for this Owner
Home Financials are based on the most recent Mortgage that was taken out on this home.
Original Mortgage
$200,000
Outstanding Balance
$181,588
Interest Rate
2.8%
Mortgage Type
New Conventional
Estimated Equity
$633,557
Purchase Details
Closed on
Dec 28, 2017
Sold by
Harris Mary Anne R and Harris Frank Wade
Bought by
Harris Mary Anne R
Home Financials for this Owner
Home Financials are based on the most recent Mortgage that was taken out on this home.
Original Mortgage
$15,000
Interest Rate
3.95%
Mortgage Type
Credit Line Revolving
Purchase Details
Closed on
May 30, 1996
Sold by
Morrison James A and Morrison Norma E
Bought by
Harris Frank W and Harris Mary Anne R
Home Financials for this Owner
Home Financials are based on the most recent Mortgage that was taken out on this home.
Original Mortgage
$152,550
Interest Rate
7.97%
Create a Home Valuation Report for This Property
The Home Valuation Report is an in-depth analysis detailing your home's value as well as a comparison with similar homes in the area
Home Values in the Area
Average Home Value in this Area
Purchase History
| Date | Buyer | Sale Price | Title Company |
|---|---|---|---|
| Roberts Harris Maryanne | -- | Real Advantage Title Ins | |
| Harris Mary Anne R | -- | First American Title Ins Co | |
| Harris Frank W | -- | First American Title |
Source: Public Records
Mortgage History
| Date | Status | Borrower | Loan Amount |
|---|---|---|---|
| Open | Roberts Harris Maryanne | $200,000 | |
| Closed | Harris Mary Anne R | $15,000 | |
| Closed | Harris Frank W | $152,550 |
Source: Public Records
Tax History Compared to Growth
Tax History
| Year | Tax Paid | Tax Assessment Tax Assessment Total Assessment is a certain percentage of the fair market value that is determined by local assessors to be the total taxable value of land and additions on the property. | Land | Improvement |
|---|---|---|---|---|
| 2025 | $3,167 | $593,505 | $277,418 | $316,087 |
| 2024 | $3,035 | $580,000 | $290,012 | $289,988 |
| 2023 | $2,790 | $526,000 | $286,685 | $239,315 |
| 2022 | $2,793 | $295,109 | $157,677 | $137,432 |
| 2021 | $2,265 | $403,157 | $187,862 | $215,295 |
| 2020 | $2,097 | $342,548 | $147,396 | $195,152 |
| 2019 | $2,053 | $320,966 | $137,762 | $183,204 |
| 2018 | $1,912 | $286,488 | $112,706 | $173,782 |
| 2017 | $1,783 | $263,000 | $98,622 | $164,378 |
| 2016 | $1,808 | $144,821 | $48,782 | $96,039 |
| 2015 | $1,743 | $138,167 | $43,379 | $94,788 |
| 2014 | $1,556 | $120,376 | $43,379 | $76,997 |
Source: Public Records
Map
Nearby Homes
- 409 N 9000 E
- 8927 Pineview Dr
- 8842 E 500 S
- 241 S 8600 E
- 567 S 8850 E
- 8817 Mountain Valley Dr
- 8307 Utah 39
- 9783 E Highway 39
- 9658 E Kelley Dr Unit 65
- 8822 E Eagle Way St Unit 7
- 1331 N Maple Dr Unit 99
- 441 S 7900 E
- 4400 Plan at Sage - SAGE
- 4200 Plan at Sage - SAGE
- 3500 Plan at Sage - SAGE
- 7643 E 500 S
- 484 S 7900 E Unit 9
- 335 S 7900 E Unit 15
- 423 S 7900 E Unit 12
- 249 S 7900 E Unit 18