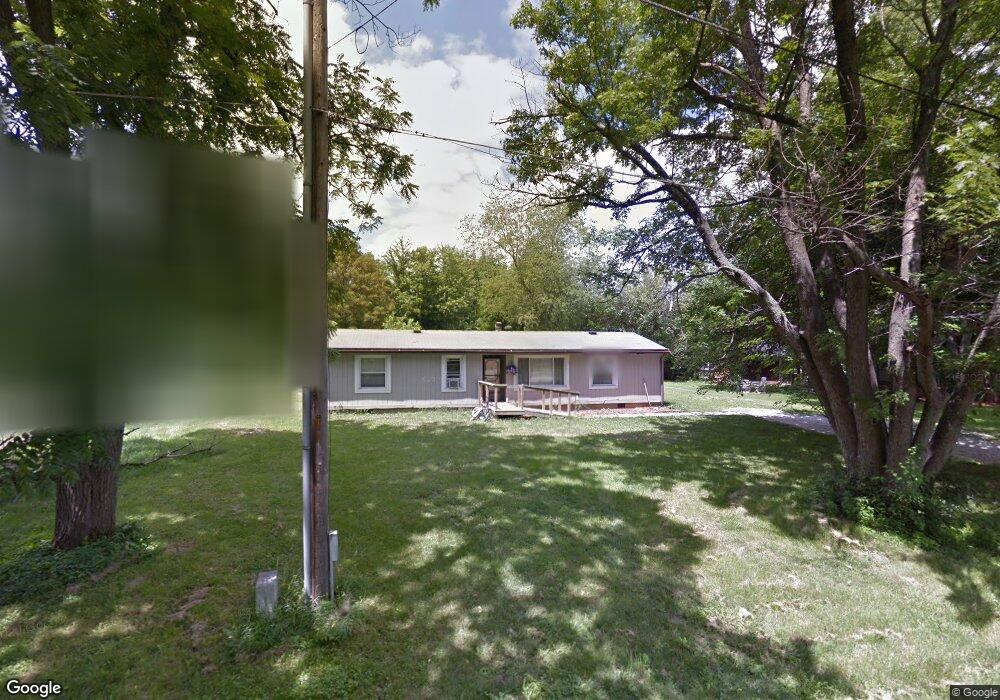
319 N Kibby St Clinton, IN 47842
Estimated Value: $28,000 - $188,000
3
Beds
2
Baths
1,272
Sq Ft
$96/Sq Ft
Est. Value
About This Home
This home is located at 319 N Kibby St, Clinton, IN 47842 and is currently estimated at $121,667, approximately $95 per square foot. 319 N Kibby St is a home located in Vermillion County with nearby schools including South Vermillion High School and Sacred Heart School.
Ownership History
Date
Name
Owned For
Owner Type
Purchase Details
Closed on
Oct 20, 2022
Sold by
Mobley Joe and Mobley Jackie L
Bought by
Frazier Ashdon D
Current Estimated Value
Purchase Details
Closed on
May 17, 2021
Sold by
Moulton Michael G
Bought by
Mobley Joe and Mobley Jackie L
Purchase Details
Closed on
May 16, 2016
Sold by
Williams Larry
Bought by
Moulton Michael G
Purchase Details
Closed on
Feb 23, 2012
Sold by
Williams Larry
Bought by
Hatcher Jason and Hatcher Cynthia
Create a Home Valuation Report for This Property
The Home Valuation Report is an in-depth analysis detailing your home's value as well as a comparison with similar homes in the area
Home Values in the Area
Average Home Value in this Area
Purchase History
| Date | Buyer | Sale Price | Title Company |
|---|---|---|---|
| Frazier Ashdon D | -- | None Listed On Document | |
| Mobley Joe | -- | None Available | |
| Moulton Michael G | $10,000 | -- | |
| Hatcher Jason | $25,000 | -- | |
| Hatcher Jason | $25,000 | -- |
Source: Public Records
Tax History Compared to Growth
Tax History
| Year | Tax Paid | Tax Assessment Tax Assessment Total Assessment is a certain percentage of the fair market value that is determined by local assessors to be the total taxable value of land and additions on the property. | Land | Improvement |
|---|---|---|---|---|
| 2024 | $12 | $600 | $600 | $0 |
| 2023 | $17 | $600 | $600 | $0 |
| 2022 | $125 | $4,500 | $4,500 | $0 |
| 2021 | $738 | $36,900 | $30,900 | $6,000 |
| 2020 | $550 | $27,500 | $22,000 | $5,500 |
| 2019 | $556 | $27,800 | $22,000 | $5,800 |
| 2018 | $308 | $15,400 | $8,900 | $6,500 |
| 2017 | $304 | $15,200 | $8,900 | $6,300 |
| 2016 | $54 | $15,000 | $8,900 | $6,100 |
| 2014 | $51 | $14,600 | $8,900 | $5,700 |
| 2013 | $51 | $14,600 | $8,900 | $5,700 |
Source: Public Records
Map
Nearby Homes
- 312 S Fulton St
- 162 N Gilbert St
- 1219 W 2nd St
- 539 S Lincoln St
- 736 S Fulton St
- 548 E 7th St
- 775 S Lincoln St
- 368 S Jackson St
- 1245 N 11th St
- 1162 W Ewing St
- 1108 W Ewing St
- 1102 Matthews St
- 945 Morey St
- 18 Golf Ln
- 821 N 8th St
- 15034 S Willow Grove Ave
- 1095 Oakridge Dr
- 200 E Clinton Ct
- 522 N Main St
- 359 N 3rd St