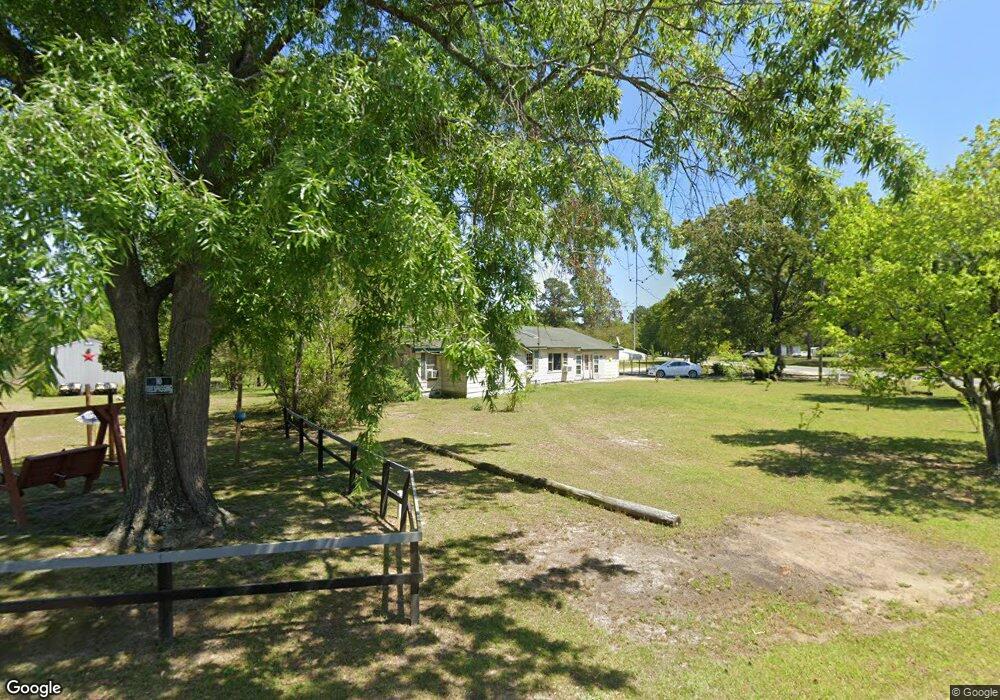
319 N Lake Rd Red Springs, NC 28377
Estimated Value: $138,000 - $280,000
--
Bed
1
Bath
2,771
Sq Ft
$79/Sq Ft
Est. Value
About This Home
This home is located at 319 N Lake Rd, Red Springs, NC 28377 and is currently estimated at $219,151, approximately $79 per square foot. 319 N Lake Rd is a home located in Hoke County with nearby schools including Hawk Eye Elementary School, Sandy Grove Middle School, and Hoke County High.
Ownership History
Date
Name
Owned For
Owner Type
Purchase Details
Closed on
Aug 15, 2008
Sold by
Maynor Ernie and Maynor Marsha Rose
Bought by
Hall Audrey Baker and Hall James E
Current Estimated Value
Home Financials for this Owner
Home Financials are based on the most recent Mortgage that was taken out on this home.
Original Mortgage
$48,000
Outstanding Balance
$31,473
Interest Rate
6.31%
Mortgage Type
Future Advance Clause Open End Mortgage
Estimated Equity
$187,678
Create a Home Valuation Report for This Property
The Home Valuation Report is an in-depth analysis detailing your home's value as well as a comparison with similar homes in the area
Home Values in the Area
Average Home Value in this Area
Purchase History
| Date | Buyer | Sale Price | Title Company |
|---|---|---|---|
| Hall Audrey Baker | $60,000 | None Available |
Source: Public Records
Mortgage History
| Date | Status | Borrower | Loan Amount |
|---|---|---|---|
| Open | Hall Audrey Baker | $48,000 |
Source: Public Records
Tax History Compared to Growth
Tax History
| Year | Tax Paid | Tax Assessment Tax Assessment Total Assessment is a certain percentage of the fair market value that is determined by local assessors to be the total taxable value of land and additions on the property. | Land | Improvement |
|---|---|---|---|---|
| 2024 | $793 | $159,750 | $40,000 | $119,750 |
| 2023 | $1,456 | $159,750 | $40,000 | $119,750 |
| 2022 | $0 | $159,750 | $40,000 | $119,750 |
| 2021 | $1,328 | $143,800 | $12,500 | $131,300 |
| 2020 | $1,350 | $143,800 | $12,500 | $131,300 |
| 2019 | $1,350 | $143,800 | $12,500 | $131,300 |
| 2018 | $894 | $90,080 | $12,500 | $77,580 |
| 2017 | $894 | $90,080 | $12,500 | $77,580 |
| 2016 | $878 | $90,080 | $12,500 | $77,580 |
| 2015 | $878 | $90,080 | $12,500 | $77,580 |
| 2014 | $858 | $90,080 | $12,500 | $77,580 |
| 2013 | -- | $83,150 | $10,000 | $73,150 |
Source: Public Records
Map
Nearby Homes