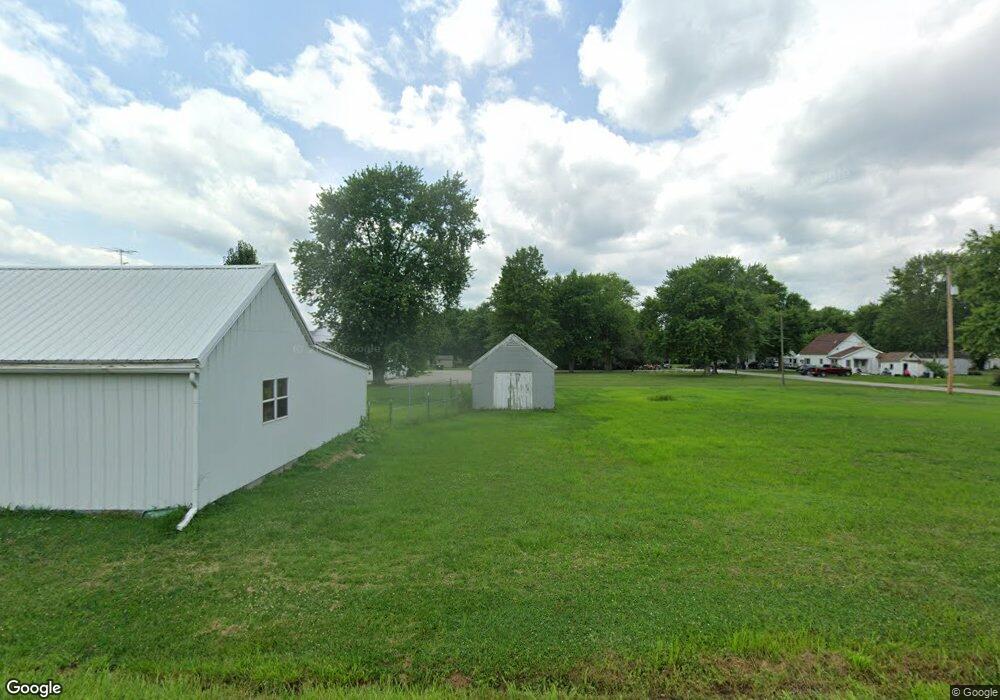
319 N Palmer Fillmore, IL 62032
Estimated Value: $99,718 - $192,000
4
Beds
2
Baths
1,414
Sq Ft
$90/Sq Ft
Est. Value
About This Home
This home is located at 319 N Palmer, Fillmore, IL 62032 and is currently estimated at $127,930, approximately $90 per square foot. 319 N Palmer is a home located in Montgomery County with nearby schools including North Elementary School and Nokomis Junior/Senior High School.
Ownership History
Date
Name
Owned For
Owner Type
Purchase Details
Closed on
Jun 21, 2023
Sold by
Sanders Glenna F
Bought by
Valebcua Anthony D and Valebcua Brittany
Current Estimated Value
Home Financials for this Owner
Home Financials are based on the most recent Mortgage that was taken out on this home.
Original Mortgage
$76,473
Outstanding Balance
$74,690
Interest Rate
7.13%
Mortgage Type
New Conventional
Estimated Equity
$53,240
Purchase Details
Closed on
May 24, 2012
Sold by
Walker Marcia D and Walker Maurice G
Bought by
Sanders William E and Sanders Glenna F
Create a Home Valuation Report for This Property
The Home Valuation Report is an in-depth analysis detailing your home's value as well as a comparison with similar homes in the area
Home Values in the Area
Average Home Value in this Area
Purchase History
| Date | Buyer | Sale Price | Title Company |
|---|---|---|---|
| Valebcua Anthony D | $70,000 | Spears Title | |
| Sanders William E | $47,000 | Community Title & Escrow |
Source: Public Records
Mortgage History
| Date | Status | Borrower | Loan Amount |
|---|---|---|---|
| Open | Valebcua Anthony D | $76,473 |
Source: Public Records
Tax History Compared to Growth
Tax History
| Year | Tax Paid | Tax Assessment Tax Assessment Total Assessment is a certain percentage of the fair market value that is determined by local assessors to be the total taxable value of land and additions on the property. | Land | Improvement |
|---|---|---|---|---|
| 2024 | $721 | $13,670 | $2,150 | $11,520 |
| 2023 | -- | $12,840 | $2,020 | $10,820 |
| 2022 | $0 | $12,440 | $1,960 | $10,480 |
| 2021 | $0 | $11,730 | $1,850 | $9,880 |
| 2020 | $0 | $10,980 | $1,730 | $9,250 |
| 2019 | $0 | $10,560 | $1,660 | $8,900 |
| 2018 | $0 | $10,070 | $1,580 | $8,490 |
| 2017 | $0 | $9,770 | $1,530 | $8,240 |
| 2016 | $0 | $9,600 | $1,500 | $8,100 |
| 2015 | -- | $9,750 | $1,520 | $8,230 |
| 2013 | -- | $9,650 | $1,500 | $8,150 |
Source: Public Records
Map
Nearby Homes
- 000 E 24th Rd
- 456 E 2595 Ave
- 299 E 3050 Ave
- 106 Locust St
- TBD Red Ball Trail
- 102 3rd St
- 0 Sec 29-7-1w Unit MIS25047631
- 171 Red Ball Trail
- 694 E 2735 Ave
- 215 S Pine St
- 225 E 5th St
- 318 E 5th St
- 836 E 2650 Ave
- 425 N Pine St
- Three Miles South of Nokomis
- 2672 Us Highway 51
- 0
- 5 Remond St
- 1 Anchor Ave
- 1847 Jaketown Rd
- 320 E Walnut St
- 206 N Palmer
- 214 N Cleveland St
- 401 N Palmer
- 403 E North St
- 402 N Palmer
- 400 N Cleveland St
- 303 N Richmond St
- 315 N Cleveland St
- 301 N Cleveland St
- 418 E Pine St
- 217 N Cleveland St
- 221 E Pine St
- 414 N Palmer
- 421 E North St
- 417 N Palmer St
- 306 N Richmond St
- 111 N Palmer
- 312 N Richmond St
- 415 N Richmond St