Estimated Value: $107,000 - $145,000
2
Beds
1
Bath
732
Sq Ft
$172/Sq Ft
Est. Value
About This Home
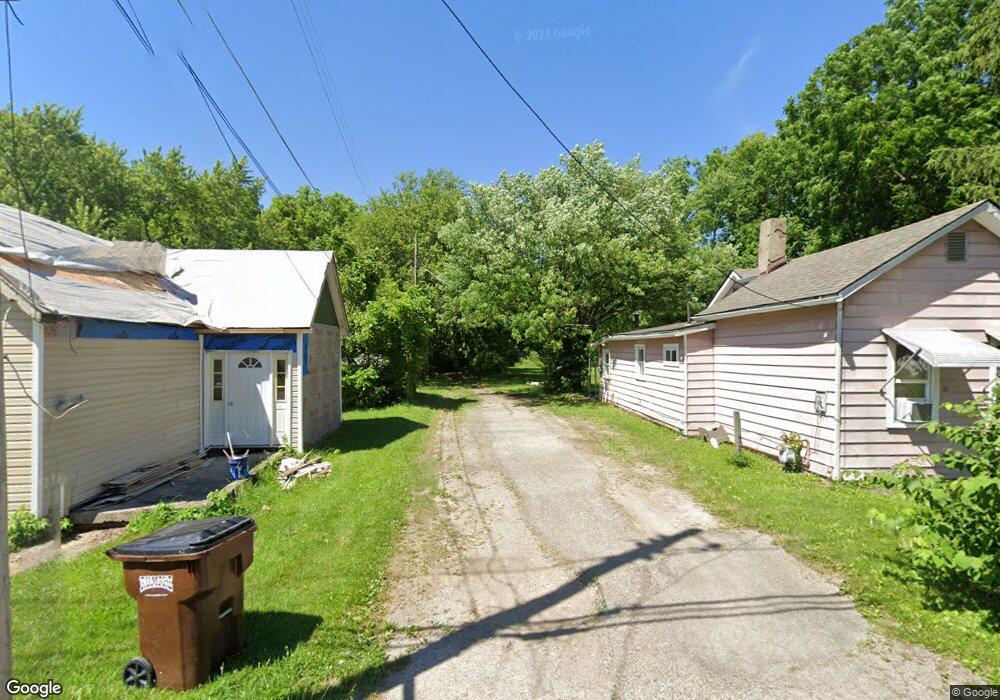
This home is located at 319 N West St, Xenia, OH 45385 and is currently estimated at $125,667, approximately $171 per square foot. 319 N West St is a home located in Greene County with nearby schools including Xenia High School, Summit Academy Community School for Alternative Learners - Xenia, and Legacy Christian Academy.
Ownership History
Date
Name
Owned For
Owner Type
Purchase Details
Closed on
Apr 17, 2024
Sold by
Zilhaver Shawn M
Bought by
Double E Properties Llc
Current Estimated Value
Purchase Details
Closed on
Jul 22, 2003
Sold by
Clary Patricia M
Bought by
Clary Patricia M and Zilhaver Shawn M
Home Financials for this Owner
Home Financials are based on the most recent Mortgage that was taken out on this home.
Original Mortgage
$54,500
Interest Rate
5.31%
Mortgage Type
Unknown
Purchase Details
Closed on
Jun 17, 1999
Sold by
Yeaples Beulah A
Bought by
Clary Patricia M
Home Financials for this Owner
Home Financials are based on the most recent Mortgage that was taken out on this home.
Original Mortgage
$44,000
Interest Rate
7.06%
Purchase Details
Closed on
Oct 2, 1995
Sold by
Filson Mark A
Bought by
Yeaples Beulah A
Create a Home Valuation Report for This Property
The Home Valuation Report is an in-depth analysis detailing your home's value as well as a comparison with similar homes in the area
Home Values in the Area
Average Home Value in this Area
Purchase History
| Date | Buyer | Sale Price | Title Company |
|---|---|---|---|
| Double E Properties Llc | $64,000 | None Listed On Document | |
| Clary Patricia M | -- | -- | |
| Clary Patricia M | $55,000 | -- | |
| Yeaples Beulah A | $48,500 | -- |
Source: Public Records
Mortgage History
| Date | Status | Borrower | Loan Amount |
|---|---|---|---|
| Previous Owner | Clary Patricia M | $54,500 | |
| Previous Owner | Clary Patricia M | $44,000 |
Source: Public Records
Tax History Compared to Growth
Tax History
| Year | Tax Paid | Tax Assessment Tax Assessment Total Assessment is a certain percentage of the fair market value that is determined by local assessors to be the total taxable value of land and additions on the property. | Land | Improvement |
|---|---|---|---|---|
| 2024 | $1,200 | $28,050 | $7,790 | $20,260 |
| 2023 | $1,200 | $28,050 | $7,790 | $20,260 |
| 2022 | $1,000 | $19,940 | $4,870 | $15,070 |
| 2021 | $1,503 | $19,940 | $4,870 | $15,070 |
| 2020 | $971 | $19,940 | $4,870 | $15,070 |
| 2019 | $721 | $13,930 | $4,590 | $9,340 |
| 2018 | $262 | $13,930 | $4,590 | $9,340 |
| 2017 | $268 | $13,930 | $4,590 | $9,340 |
| 2016 | $269 | $13,960 | $4,590 | $9,370 |
| 2015 | $269 | $13,960 | $4,590 | $9,370 |
| 2014 | $258 | $13,960 | $4,590 | $9,370 |
Source: Public Records
Map
Nearby Homes
- 335 N West St
- 309 N West St
- 320 N West St
- 334 N West St
- 343 N West St
- 299 N West St
- 342 N West St
- 353 N West St
- 361 N West St
- 289 N West St
- 371 N West St
- 223 Pleasant St
- 316 N Galloway St
- 330 N Galloway St
- 251 Pleasant St
- 380 N West St
- 338 N Galloway St
- 300 N Galloway St
- 348 N Galloway St
- 239 Pleasant St