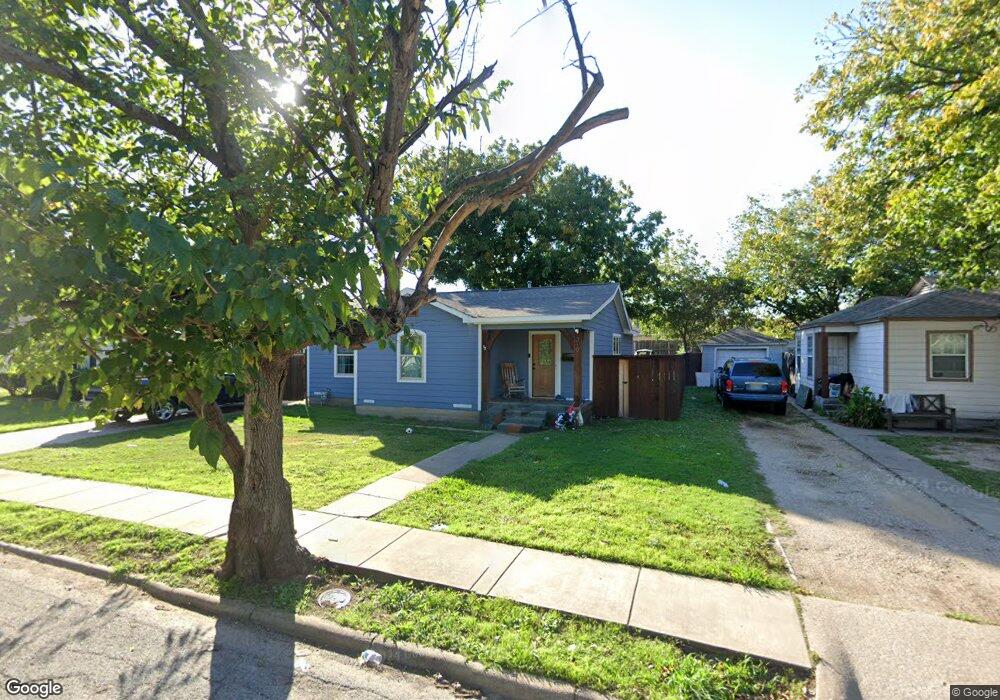
319 NE 10th St Grand Prairie, TX 75050
Estimated Value: $204,465 - $226,000
2
Beds
1
Bath
1,164
Sq Ft
$185/Sq Ft
Est. Value
About This Home
This home is located at 319 NE 10th St, Grand Prairie, TX 75050 and is currently estimated at $215,366, approximately $185 per square foot. 319 NE 10th St is a home located in Dallas County with nearby schools including Crosswinds High School, James Fannin Middle, and Grand Prairie High School.
Ownership History
Date
Name
Owned For
Owner Type
Purchase Details
Closed on
Jul 3, 2017
Sold by
Chicosky Christine
Bought by
Cordero Benito
Current Estimated Value
Home Financials for this Owner
Home Financials are based on the most recent Mortgage that was taken out on this home.
Original Mortgage
$103,305
Outstanding Balance
$85,947
Interest Rate
3.94%
Mortgage Type
New Conventional
Estimated Equity
$129,419
Purchase Details
Closed on
May 5, 2004
Sold by
Delvin Daisy
Bought by
Chicosky Christine
Home Financials for this Owner
Home Financials are based on the most recent Mortgage that was taken out on this home.
Original Mortgage
$63,650
Interest Rate
7.24%
Mortgage Type
Purchase Money Mortgage
Create a Home Valuation Report for This Property
The Home Valuation Report is an in-depth analysis detailing your home's value as well as a comparison with similar homes in the area
Home Values in the Area
Average Home Value in this Area
Purchase History
| Date | Buyer | Sale Price | Title Company |
|---|---|---|---|
| Cordero Benito | -- | None Available | |
| Chicosky Christine | -- | -- |
Source: Public Records
Mortgage History
| Date | Status | Borrower | Loan Amount |
|---|---|---|---|
| Open | Cordero Benito | $103,305 | |
| Previous Owner | Chicosky Christine | $63,650 |
Source: Public Records
Tax History Compared to Growth
Tax History
| Year | Tax Paid | Tax Assessment Tax Assessment Total Assessment is a certain percentage of the fair market value that is determined by local assessors to be the total taxable value of land and additions on the property. | Land | Improvement |
|---|---|---|---|---|
| 2025 | $1,494 | $199,600 | $45,000 | $154,600 |
| 2024 | $1,494 | $190,430 | $45,000 | $145,430 |
| 2023 | $1,494 | $195,000 | $40,000 | $155,000 |
| 2022 | $3,198 | $126,070 | $40,000 | $86,070 |
| 2021 | $2,602 | $97,910 | $25,000 | $72,910 |
| 2020 | $2,648 | $93,930 | $25,000 | $68,930 |
| 2019 | $1,705 | $90,540 | $0 | $0 |
| 2018 | $2,075 | $71,010 | $15,000 | $56,010 |
| 2017 | $2,073 | $71,010 | $15,000 | $56,010 |
| 2016 | $1,573 | $53,860 | $12,000 | $41,860 |
| 2015 | $1,323 | $48,030 | $10,000 | $38,030 |
| 2014 | $1,323 | $47,270 | $10,000 | $37,270 |
Source: Public Records
Map
Nearby Homes