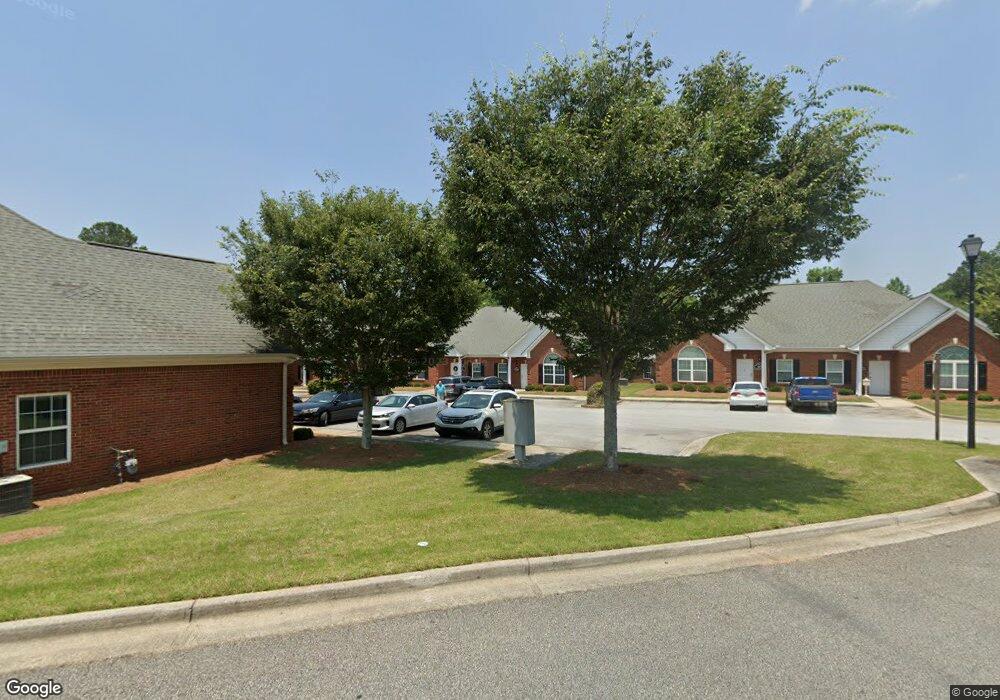
319 Resource Pkwy Unit A Winder, GA 30680
Estimated Value: $144,274
--
Bed
--
Bath
1,125
Sq Ft
$128/Sq Ft
Est. Value
About This Home
This home is located at 319 Resource Pkwy Unit A, Winder, GA 30680 and is currently estimated at $144,274, approximately $128 per square foot. 319 Resource Pkwy Unit A is a home located in Barrow County with nearby schools including Kennedy Elementary School, Westside Middle School, and Apalachee High School.
Ownership History
Date
Name
Owned For
Owner Type
Purchase Details
Closed on
Nov 27, 2023
Sold by
Zgraggen Stephanie Marie
Bought by
Seabolt Property Group Llc
Current Estimated Value
Purchase Details
Closed on
Oct 28, 2013
Sold by
Scbt
Bought by
Terreck Holdings Llc
Purchase Details
Closed on
Apr 19, 2012
Sold by
Summit Tutoring Centers In
Bought by
Scbt Na
Purchase Details
Closed on
Feb 19, 2008
Sold by
Top Notch Tutoring & Education
Bought by
Summit Tutoring Cntrs Inc
Home Financials for this Owner
Home Financials are based on the most recent Mortgage that was taken out on this home.
Original Mortgage
$122,566
Interest Rate
6.06%
Mortgage Type
Commercial
Purchase Details
Closed on
Jan 9, 2007
Sold by
Star Home Builders Inc
Bought by
Top Notch Tutoring & Educational Center
Purchase Details
Closed on
Dec 7, 2006
Sold by
Ezeuka Eric and Ezeuka Cindy
Bought by
Ezeuka Eric and Ezeuka Joy
Purchase Details
Closed on
Sep 2, 2004
Bought by
Star Home Builders Inc
Create a Home Valuation Report for This Property
The Home Valuation Report is an in-depth analysis detailing your home's value as well as a comparison with similar homes in the area
Home Values in the Area
Average Home Value in this Area
Purchase History
| Date | Buyer | Sale Price | Title Company |
|---|---|---|---|
| Seabolt Property Group Llc | -- | -- | |
| Terreck Holdings Llc | $68,200 | -- | |
| Scbt Na | -- | -- | |
| Summit Tutoring Cntrs Inc | $122,000 | -- | |
| Top Notch Tutoring & Educational Center | $139,000 | -- | |
| Ezeuka Eric | -- | -- | |
| Star Home Builders Inc | -- | -- |
Source: Public Records
Mortgage History
| Date | Status | Borrower | Loan Amount |
|---|---|---|---|
| Previous Owner | Summit Tutoring Cntrs Inc | $122,566 |
Source: Public Records
Tax History Compared to Growth
Tax History
| Year | Tax Paid | Tax Assessment Tax Assessment Total Assessment is a certain percentage of the fair market value that is determined by local assessors to be the total taxable value of land and additions on the property. | Land | Improvement |
|---|---|---|---|---|
| 2024 | $1,382 | $48,382 | $1,740 | $46,642 |
| 2023 | $1,377 | $48,382 | $1,740 | $46,642 |
| 2022 | $1,630 | $48,382 | $1,740 | $46,642 |
| 2021 | $1,504 | $41,832 | $11,600 | $30,232 |
| 2020 | $1,459 | $41,832 | $11,600 | $30,232 |
| 2019 | $1,479 | $41,832 | $11,600 | $30,232 |
| 2018 | $1,476 | $41,832 | $11,600 | $30,232 |
| 2017 | $1,181 | $39,573 | $11,600 | $27,973 |
| 2016 | $1,205 | $34,945 | $11,600 | $23,345 |
| 2015 | $1,214 | $35,204 | $11,600 | $23,604 |
| 2014 | $958 | $31,703 | $7,840 | $23,863 |
| 2013 | -- | $30,164 | $6,860 | $23,304 |
Source: Public Records
Map
Nearby Homes
- 1428 Box Cir
- 1468 Box Cir
- 164 Turtle Creek Dr
- 526 Terrapin Ln
- 1993 Township Dr
- 222 Turtle Creek Dr
- 1734 Snapping Ct
- 347 Turtle Creek Dr
- 348 Turtle Creek Dr
- 346 Turtle Creek Dr
- 132 Poplar Way
- 155 Horton St
- 94 Matthews School Rd
- 145 Humphry Ct
- 2036 Massey Ln
- 132 Circle Dr
- 98 Circle Dr
- 0 Horton St Unit 10650235
- 0 Horton St Unit 10643908
- 0 Horton St Unit 7688404
- 319 Resource Pkwy
- 321 Resource Pkwy Unit B
- 321 Resource Pkwy
- 317 Resource Pkwy
- 325 Resource Pkwy
- 325 Resource Pkwy Unit 6B
- 313 Resource Pkwy
- 200202 Resource Ln
- 367 Resource Pkwy Unit BLDG B UNITB
- 367 Resource Pkwy Unit BB,UB
- 367 Resource Pkwy
- 365 Resource Pkwy
- 365 Resource Pkwy Unit 8A
- 429 Loganville Hwy Unit 7
- 429 Loganville Hwy Unit 3
- 429 Loganville Hwy Unit SUITE 104
- 429 Loganville Hwy Unit SUITE 103
- 429 Loganville Hwy Unit 2
- 429 Loganville Hwy
- 363 Resource Pkwy