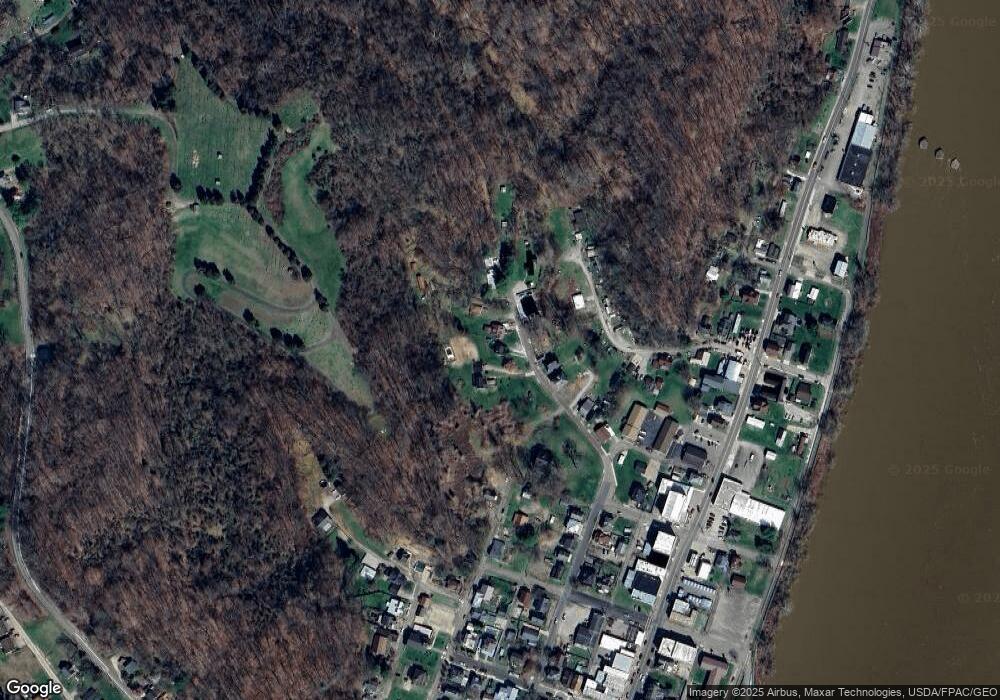
319 Rutland St Middleport, OH 45760
Estimated Value: $57,000 - $76,000
--
Bed
1
Bath
840
Sq Ft
$79/Sq Ft
Est. Value
About This Home
This home is located at 319 Rutland St, Middleport, OH 45760 and is currently estimated at $66,594, approximately $79 per square foot. 319 Rutland St is a home located in Meigs County with nearby schools including Meigs Primary School, Meigs Intermediate School, and Meigs Middle School.
Ownership History
Date
Name
Owned For
Owner Type
Purchase Details
Closed on
Feb 19, 2020
Sold by
Dowell Jeffrey S and Dowell Erica R
Bought by
Johnson Phyllis I
Current Estimated Value
Home Financials for this Owner
Home Financials are based on the most recent Mortgage that was taken out on this home.
Original Mortgage
$37,500
Outstanding Balance
$18,232
Interest Rate
3.6%
Mortgage Type
Unknown
Estimated Equity
$48,362
Purchase Details
Closed on
Apr 19, 2018
Sold by
Kloes June S and Kloes June
Bought by
Dowell Jeffrey S
Purchase Details
Closed on
May 24, 1984
Bought by
Kloes June S Kloes Norman M
Create a Home Valuation Report for This Property
The Home Valuation Report is an in-depth analysis detailing your home's value as well as a comparison with similar homes in the area
Home Values in the Area
Average Home Value in this Area
Purchase History
| Date | Buyer | Sale Price | Title Company |
|---|---|---|---|
| Johnson Phyllis I | $47,500 | None Available | |
| Dowell Jeffrey S | $46,200 | None Available | |
| Kloes June S Kloes Norman M | $21,500 | -- |
Source: Public Records
Mortgage History
| Date | Status | Borrower | Loan Amount |
|---|---|---|---|
| Open | Johnson Phyllis I | $37,500 |
Source: Public Records
Tax History Compared to Growth
Tax History
| Year | Tax Paid | Tax Assessment Tax Assessment Total Assessment is a certain percentage of the fair market value that is determined by local assessors to be the total taxable value of land and additions on the property. | Land | Improvement |
|---|---|---|---|---|
| 2024 | $145 | $13,450 | $3,540 | $9,910 |
| 2023 | $145 | $13,450 | $3,540 | $9,910 |
| 2022 | $181 | $13,450 | $3,540 | $9,910 |
| 2021 | $220 | $13,750 | $3,460 | $10,290 |
| 2020 | $609 | $13,750 | $3,460 | $10,290 |
| 2019 | $603 | $13,750 | $3,460 | $10,290 |
| 2018 | $532 | $12,420 | $2,420 | $10,000 |
| 2017 | $532 | $12,420 | $2,420 | $10,000 |
| 2016 | $539 | $12,420 | $2,420 | $10,000 |
| 2014 | $445 | $11,200 | $2,370 | $8,830 |
| 2013 | $445 | $11,200 | $2,370 | $8,830 |
Source: Public Records
Map
Nearby Homes