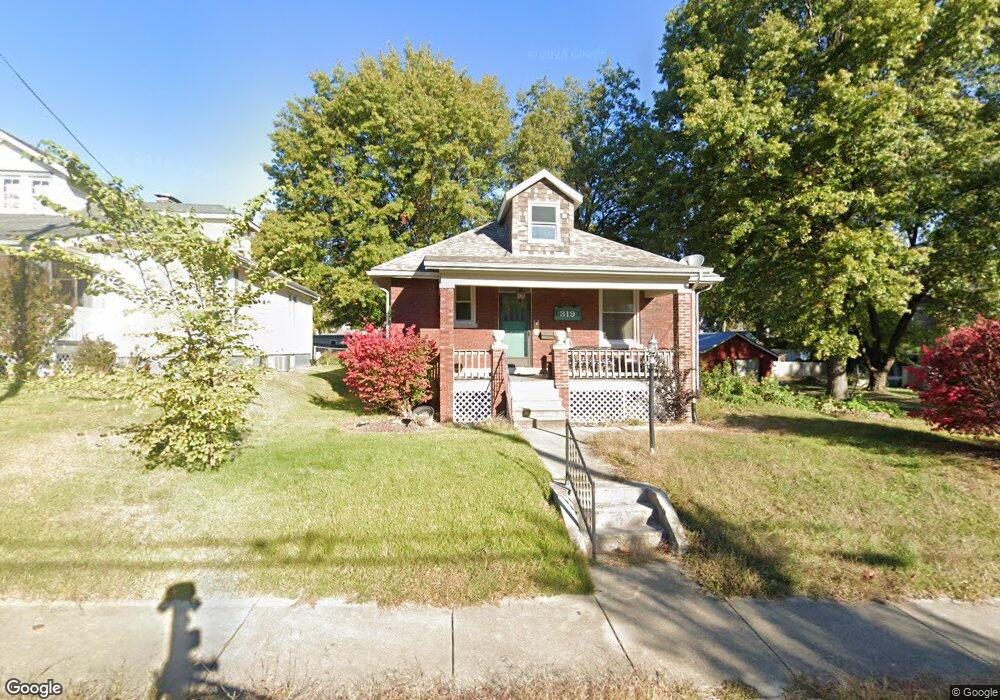
319 S 11th St Belleville, IL 62220
Estimated Value: $60,166 - $142,000
--
Bed
--
Bath
--
Sq Ft
6,098
Sq Ft Lot
About This Home
This home is located at 319 S 11th St, Belleville, IL 62220 and is currently estimated at $104,292. 319 S 11th St is a home located in St. Clair County with nearby schools including Henry Raab Elementary School, Central Jr High School, and Governor French Academy.
Ownership History
Date
Name
Owned For
Owner Type
Purchase Details
Closed on
Jun 22, 2016
Sold by
Fannie Mae
Bought by
Conoyer Nelda
Current Estimated Value
Home Financials for this Owner
Home Financials are based on the most recent Mortgage that was taken out on this home.
Original Mortgage
$19,500
Interest Rate
3.58%
Mortgage Type
Commercial
Purchase Details
Closed on
Feb 27, 2016
Sold by
Murphy Brent T and Murphy Laura A
Bought by
Federal National Mortgage Association
Purchase Details
Closed on
Apr 27, 2001
Sold by
Shea Candace M and Shea Dennis
Bought by
Murphy Brent T and Murphy Laura A
Home Financials for this Owner
Home Financials are based on the most recent Mortgage that was taken out on this home.
Original Mortgage
$84,671
Interest Rate
6.95%
Mortgage Type
FHA
Create a Home Valuation Report for This Property
The Home Valuation Report is an in-depth analysis detailing your home's value as well as a comparison with similar homes in the area
Home Values in the Area
Average Home Value in this Area
Purchase History
| Date | Buyer | Sale Price | Title Company |
|---|---|---|---|
| Conoyer Nelda | -- | Fatic | |
| Federal National Mortgage Association | -- | Attorney | |
| Murphy Brent T | $86,000 | Benchmark Title Company |
Source: Public Records
Mortgage History
| Date | Status | Borrower | Loan Amount |
|---|---|---|---|
| Closed | Conoyer Nelda | $19,500 | |
| Previous Owner | Murphy Brent T | $84,671 |
Source: Public Records
Tax History Compared to Growth
Tax History
| Year | Tax Paid | Tax Assessment Tax Assessment Total Assessment is a certain percentage of the fair market value that is determined by local assessors to be the total taxable value of land and additions on the property. | Land | Improvement |
|---|---|---|---|---|
| 2024 | $590 | $6,711 | $3,858 | $2,853 |
| 2023 | $609 | $6,486 | $3,781 | $2,705 |
| 2022 | $559 | $5,839 | $3,404 | $2,435 |
| 2021 | $538 | $5,398 | $3,147 | $2,251 |
| 2020 | $523 | $5,105 | $2,976 | $2,129 |
| 2019 | $504 | $4,864 | $2,982 | $1,882 |
| 2018 | $493 | $4,759 | $2,918 | $1,841 |
| 2017 | $489 | $4,725 | $2,897 | $1,828 |
| 2016 | $483 | $4,624 | $2,835 | $1,789 |
| 2014 | $458 | $4,951 | $3,246 | $1,705 |
| 2013 | $453 | $5,021 | $3,292 | $1,729 |
Source: Public Records
Map
Nearby Homes