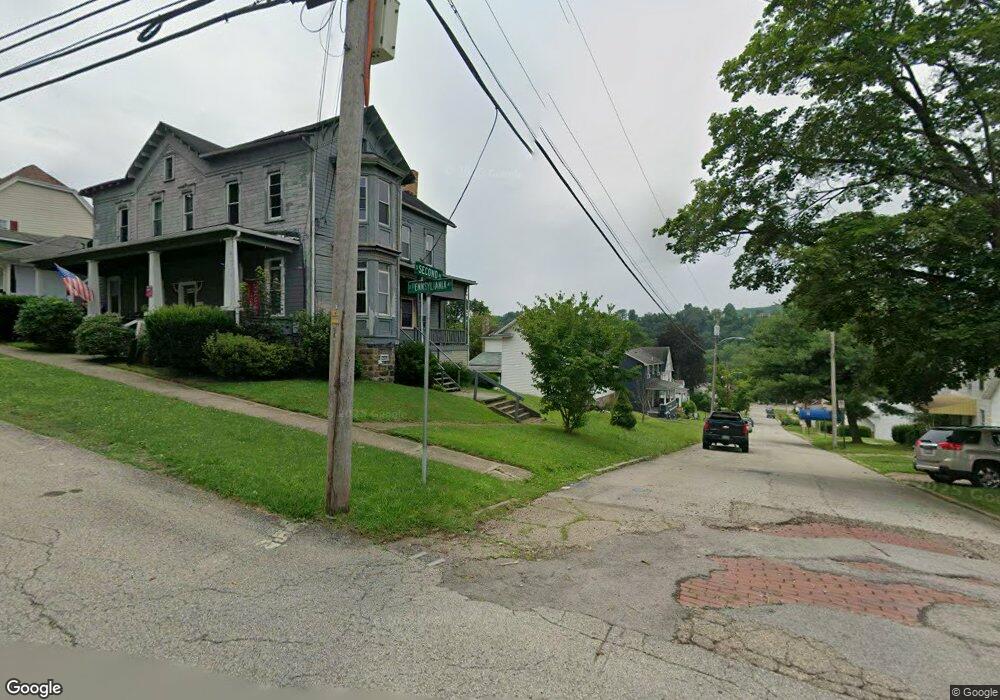
319 S 2nd St Apollo, PA 15613
Estimated Value: $97,000 - $123,000
3
Beds
1
Bath
1,542
Sq Ft
$69/Sq Ft
Est. Value
About This Home
This home is located at 319 S 2nd St, Apollo, PA 15613 and is currently estimated at $106,896, approximately $69 per square foot. 319 S 2nd St is a home located in Armstrong County with nearby schools including Orchard Hills Christian Academy.
Ownership History
Date
Name
Owned For
Owner Type
Purchase Details
Closed on
Apr 30, 2009
Sold by
Webster Daniel E and Webster Martha E
Bought by
Maines Michael W
Current Estimated Value
Home Financials for this Owner
Home Financials are based on the most recent Mortgage that was taken out on this home.
Original Mortgage
$2,321
Outstanding Balance
$1,470
Interest Rate
4.9%
Mortgage Type
FHA
Estimated Equity
$105,426
Purchase Details
Closed on
Aug 29, 2006
Sold by
Federal National Mortgage Association
Bought by
Webster Daniel E and Webster Martha E
Home Financials for this Owner
Home Financials are based on the most recent Mortgage that was taken out on this home.
Original Mortgage
$33,150
Interest Rate
6.71%
Mortgage Type
New Conventional
Purchase Details
Closed on
Jan 8, 2001
Bought by
Bergey Kevin and Bergey Jennifer K
Purchase Details
Closed on
Sep 30, 1992
Create a Home Valuation Report for This Property
The Home Valuation Report is an in-depth analysis detailing your home's value as well as a comparison with similar homes in the area
Home Values in the Area
Average Home Value in this Area
Purchase History
| Date | Buyer | Sale Price | Title Company |
|---|---|---|---|
| Maines Michael W | $57,000 | None Available | |
| Webster Daniel E | $34,900 | None Available | |
| Bergey Kevin | $60,000 | -- | |
| -- | $2,500 | -- |
Source: Public Records
Mortgage History
| Date | Status | Borrower | Loan Amount |
|---|---|---|---|
| Open | Maines Michael W | $2,321 | |
| Previous Owner | Webster Daniel E | $33,150 |
Source: Public Records
Tax History
| Year | Tax Paid | Tax Assessment Tax Assessment Total Assessment is a certain percentage of the fair market value that is determined by local assessors to be the total taxable value of land and additions on the property. | Land | Improvement |
|---|---|---|---|---|
| 2025 | $2,328 | $22,310 | $14,540 | $7,770 |
| 2024 | $2,172 | $22,310 | $14,540 | $7,770 |
| 2023 | $2,011 | $22,310 | $14,540 | $7,770 |
| 2022 | $2,011 | $22,310 | $14,540 | $7,770 |
| 2021 | $1,980 | $22,310 | $14,540 | $7,770 |
| 2020 | $1,979 | $22,310 | $14,540 | $7,770 |
| 2019 | $1,979 | $22,310 | $14,540 | $7,770 |
| 2018 | $1,917 | $20,765 | $9,670 | $11,095 |
| 2017 | $1,927 | $22,310 | $14,540 | $7,770 |
| 2016 | $1,927 | $22,310 | $14,540 | $7,770 |
| 2015 | $1,481 | $22,310 | $14,540 | $7,770 |
| 2014 | $1,481 | $22,310 | $14,540 | $7,770 |
Source: Public Records
Map
Nearby Homes
- 404 N Pennsylvania Ave
- 509 1st Street Extension
- 314 S 5th St
- 212 Terrace Ave
- 322 N 4th St
- 218 Clifford Ave
- 411a N Pennsylvania Ave
- 715 1/2 Armstrong Ave Unit 1/2
- 788 Old State Rd
- 733 N Warren Ave
- 1316 Hancock Ave
- 262 Vista Dr
- 28 McKinstry Hill Rd
- 1206 Wysocki Ave
- 93 McKinstry Hill Rd
- 1738 Hancock Ave
- 1020 Poe St
- 127 Lily St
- 712 16th St
- 208 Whittier St
- 319 S Second St
- 315 S 2nd St
- 203 S Pennsylvania Ave
- 315 S Second St
- 205 S Pennsylvania Ave
- 316 S 3rd St
- 320 S 3rd St
- 207 S Pennsylvania Ave
- 311 S 2nd St
- 321 S 2nd St Unit 321 South 2nd Street
- 209 S Pennsylvania Ave
- 320 S 2nd St
- 322 S 2nd St
- 312 S 2nd St
- 308 S 3rd St
- 109 S Pennsylvania Ave
- 319 S 3rd St
- 321 S 3rd St
- 317 S 3rd St
- 208 S Pennsylvania Ave
Your Personal Tour Guide
Ask me questions while you tour the home.