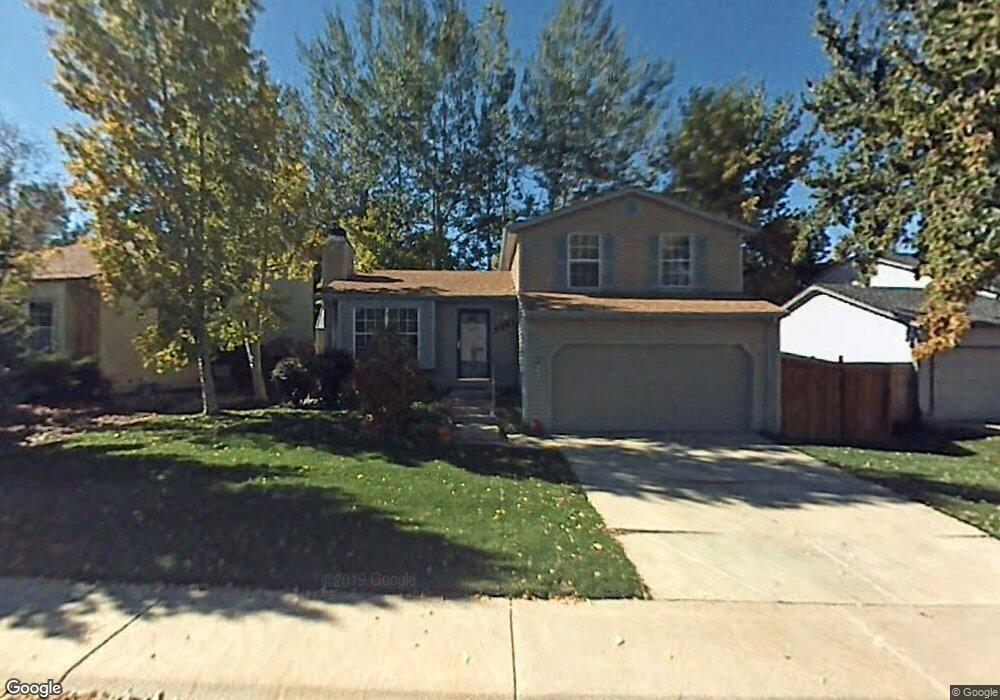
319 S Hoover Ave Louisville, CO 80027
Estimated Value: $640,000 - $706,000
3
Beds
1
Bath
1,192
Sq Ft
$561/Sq Ft
Est. Value
About This Home
This home is located at 319 S Hoover Ave, Louisville, CO 80027 and is currently estimated at $668,324, approximately $560 per square foot. 319 S Hoover Ave is a home located in Boulder County with nearby schools including Louisville Elementary School, Louisville Middle School, and Monarch High School.
Ownership History
Date
Name
Owned For
Owner Type
Purchase Details
Closed on
Dec 7, 2007
Sold by
Parish Ardyn Wyn and Estate Of Kathryn Elizabeth Ca
Bought by
Trompeter Sharon K
Current Estimated Value
Home Financials for this Owner
Home Financials are based on the most recent Mortgage that was taken out on this home.
Original Mortgage
$240,100
Outstanding Balance
$151,737
Interest Rate
6.27%
Mortgage Type
Purchase Money Mortgage
Estimated Equity
$516,587
Purchase Details
Closed on
Jan 10, 2003
Sold by
Cathey Monty and Cathey Kathryn E
Bought by
Cathey Kathryn E
Home Financials for this Owner
Home Financials are based on the most recent Mortgage that was taken out on this home.
Original Mortgage
$115,000
Interest Rate
6%
Purchase Details
Closed on
Jun 17, 1993
Bought by
Trompeter Sharon K
Purchase Details
Closed on
Aug 5, 1991
Bought by
Trompeter Sharon K
Purchase Details
Closed on
Apr 24, 1990
Bought by
Trompeter Sharon K
Purchase Details
Closed on
Apr 4, 1986
Bought by
Trompeter Sharon K
Create a Home Valuation Report for This Property
The Home Valuation Report is an in-depth analysis detailing your home's value as well as a comparison with similar homes in the area
Home Values in the Area
Average Home Value in this Area
Purchase History
| Date | Buyer | Sale Price | Title Company |
|---|---|---|---|
| Trompeter Sharon K | $245,000 | Fahtco | |
| Cathey Kathryn E | -- | Chicago Title Co | |
| Trompeter Sharon K | $107,600 | -- | |
| Trompeter Sharon K | $86,500 | -- | |
| Trompeter Sharon K | $84,000 | -- | |
| Trompeter Sharon K | -- | -- |
Source: Public Records
Mortgage History
| Date | Status | Borrower | Loan Amount |
|---|---|---|---|
| Open | Trompeter Sharon K | $240,100 | |
| Previous Owner | Cathey Kathryn E | $115,000 |
Source: Public Records
Tax History Compared to Growth
Tax History
| Year | Tax Paid | Tax Assessment Tax Assessment Total Assessment is a certain percentage of the fair market value that is determined by local assessors to be the total taxable value of land and additions on the property. | Land | Improvement |
|---|---|---|---|---|
| 2025 | $2,768 | $38,669 | $17,344 | $21,325 |
| 2024 | $2,768 | $38,669 | $17,344 | $21,325 |
| 2023 | $3,313 | $37,500 | $18,365 | $22,820 |
| 2022 | $2,910 | $30,240 | $13,643 | $16,597 |
| 2021 | $3,065 | $33,090 | $14,929 | $18,161 |
| 2020 | $2,893 | $30,917 | $14,086 | $16,831 |
| 2019 | $2,852 | $30,917 | $14,086 | $16,831 |
| 2018 | $2,455 | $27,482 | $8,064 | $19,418 |
| 2017 | $2,406 | $30,383 | $8,915 | $21,468 |
| 2016 | $2,134 | $24,255 | $9,632 | $14,623 |
| 2015 | $2,023 | $21,158 | $11,622 | $9,536 |
| 2014 | $1,809 | $21,158 | $11,622 | $9,536 |
Source: Public Records
Map
Nearby Homes
- 298 S Hoover Ave
- 111 Barbara St
- 503 Lois Dr
- 196 Lincoln Cir
- 203 Springs Dr
- 291 W Sycamore Ln
- 516 Grant Ave
- 539 Coal Creek Ln
- 529 Main St
- 242 Clementina St
- 380 County Rd
- TBD L12 County Rd 255
- TBD L14 County Rd 255
- TBD L2 County Rd 255
- TBD L8 County Rd 255
- 549 Parbois Ln
- 567 Manorwood Ln
- 385 East St
- 415 East St
- 474 W Spruce St
- 313 S Hoover Ave
- 364 Lilac Cir
- 370 Lilac Cir
- 327 S Hoover Ave
- 307 S Hoover Ave
- 358 Lilac Cir
- 403 Lilac Ct
- 380 Lilac Cir
- 303 S Hoover Ave
- 308 S Hoover Ave
- 302 S Hoover Ave
- 352 Lilac Cir
- 438 Lilac Ct
- 415 Lilac Ct
- 415 Lilac Ct Unit 1
- 388 Lilac Cir
- 349 Chestnut St
- 295 S Hoover Ave
- 357 Lilac Cir
- 355 Lilac Cir