Estimated Value: $282,300 - $320,000
3
Beds
2
Baths
1,462
Sq Ft
$203/Sq Ft
Est. Value
About This Home
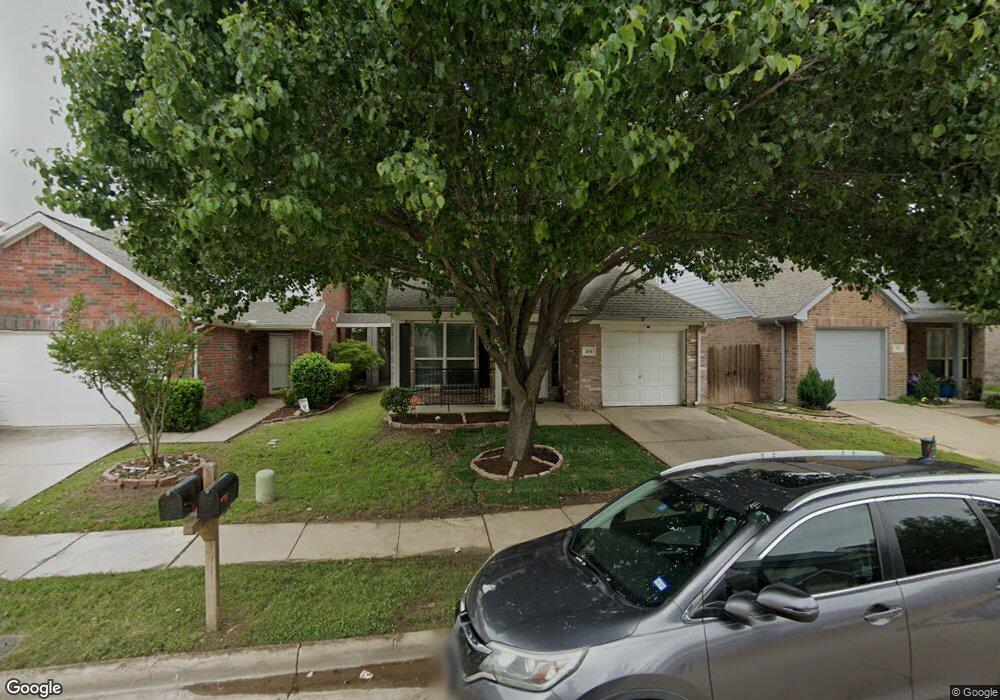
This home is located at 319 Stephanie St, Wylie, TX 75098 and is currently estimated at $297,075, approximately $203 per square foot. 319 Stephanie St is a home located in Collin County with nearby schools including T.F. Birmingham Elementary School, Frank Mcmillan Junior High School, and Davis Intermediate School.
Ownership History
Date
Name
Owned For
Owner Type
Purchase Details
Closed on
Oct 16, 2021
Sold by
Merkson Wintress
Bought by
Caldwell Wintress Merkson
Current Estimated Value
Home Financials for this Owner
Home Financials are based on the most recent Mortgage that was taken out on this home.
Original Mortgage
$165,000
Outstanding Balance
$150,465
Interest Rate
2.8%
Mortgage Type
New Conventional
Estimated Equity
$146,610
Purchase Details
Closed on
Nov 6, 2009
Sold by
Hale Diane
Bought by
Merkson Wintress
Home Financials for this Owner
Home Financials are based on the most recent Mortgage that was taken out on this home.
Original Mortgage
$130,612
Interest Rate
4.9%
Mortgage Type
New Conventional
Purchase Details
Closed on
Oct 15, 2004
Sold by
Choice Homes Inc
Bought by
Hale Diane
Home Financials for this Owner
Home Financials are based on the most recent Mortgage that was taken out on this home.
Original Mortgage
$126,925
Interest Rate
5.82%
Mortgage Type
FHA
Create a Home Valuation Report for This Property
The Home Valuation Report is an in-depth analysis detailing your home's value as well as a comparison with similar homes in the area
Home Values in the Area
Average Home Value in this Area
Purchase History
| Date | Buyer | Sale Price | Title Company |
|---|---|---|---|
| Caldwell Wintress Merkson | -- | Dhi Title | |
| Merkson Wintress | -- | Stnt | |
| Hale Diane | -- | -- |
Source: Public Records
Mortgage History
| Date | Status | Borrower | Loan Amount |
|---|---|---|---|
| Open | Caldwell Wintress Merkson | $165,000 | |
| Previous Owner | Merkson Wintress | $130,612 | |
| Previous Owner | Hale Diane | $126,925 |
Source: Public Records
Tax History Compared to Growth
Tax History
| Year | Tax Paid | Tax Assessment Tax Assessment Total Assessment is a certain percentage of the fair market value that is determined by local assessors to be the total taxable value of land and additions on the property. | Land | Improvement |
|---|---|---|---|---|
| 2025 | $3,950 | $291,166 | $90,000 | $204,185 |
| 2024 | $3,950 | $264,696 | $85,000 | $202,495 |
| 2023 | $3,950 | $240,633 | $70,000 | $207,799 |
| 2022 | $4,799 | $218,757 | $70,000 | $185,485 |
| 2021 | $4,679 | $198,870 | $60,000 | $138,870 |
| 2020 | $4,640 | $186,874 | $50,000 | $136,874 |
| 2019 | $4,630 | $176,185 | $50,000 | $138,394 |
| 2018 | $4,313 | $160,168 | $50,000 | $132,714 |
| 2017 | $3,921 | $159,485 | $45,000 | $114,485 |
| 2016 | $3,678 | $144,384 | $35,000 | $109,384 |
| 2015 | $2,843 | $129,816 | $30,000 | $99,816 |
Source: Public Records
Map
Nearby Homes
- 314 Stephanie St
- 310 Austin Ave
- 315 Celia Cir
- 708 Andersonville Ln
- 420 W Oak St
- 107 N Winding Oaks Dr
- 115 Pullman Place
- 300 S Cottonbelt Ave Unit 3A
- 205 S Cottonbelt Ave
- 804 Memorial Dr
- 903 Mardi Gras Ln
- 404 W Jefferson St
- 918 Marble Creek Dr
- 111 N Keefer Dr
- 307 W Brown St
- 934 W Cedar Creek Dr
- 612 Willow Way
- 603 Valentine Ln
- 205 Stone Cir
- 327 Crosscreek Dr
- 321 Stephanie St
- 317 Stephanie St
- 323 Stephanie St
- 315 Stephanie St
- 318 Celia Cir
- 316 Celia Cir
- 325 Stephanie St
- 313 Stephanie St
- 313 S Stephanie St
- 314 Celia Cir
- 322 Celia Cir
- 312 Celia Cir
- 311 Stephanie St
- 327 Stephanie St
- 320 Stephanie St
- 322 Stephanie St
- 318 Stephanie St
- 324 Celia Cir
- 310 Celia Cir
- 324 Stephanie St