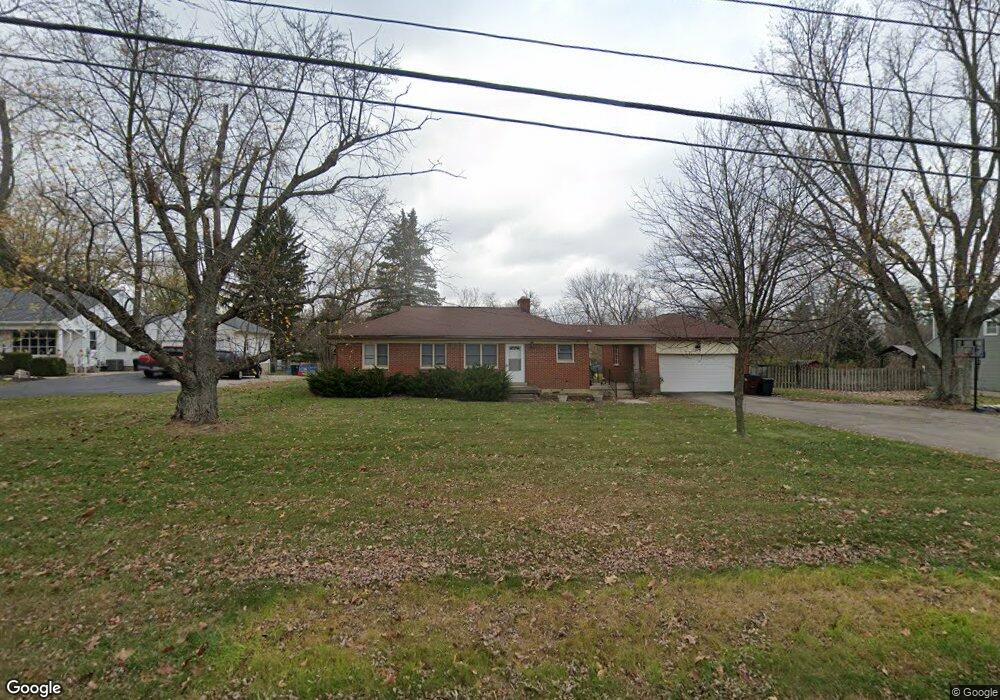
319 Stonequarry Rd Vandalia, OH 45377
Estimated Value: $245,000 - $275,000
3
Beds
2
Baths
1,452
Sq Ft
$178/Sq Ft
Est. Value
About This Home
This home is located at 319 Stonequarry Rd, Vandalia, OH 45377 and is currently estimated at $258,374, approximately $177 per square foot. 319 Stonequarry Rd is a home located in Montgomery County with nearby schools including Helke Elementary School, Morton Middle School, and Butler High School.
Ownership History
Date
Name
Owned For
Owner Type
Purchase Details
Closed on
Dec 13, 2007
Sold by
Hud
Bought by
Blakley Aaron
Current Estimated Value
Purchase Details
Closed on
Jan 11, 2007
Sold by
Helke Jeffrey L and Helke Jeffrey
Bought by
Gmac Mortgage Corp
Purchase Details
Closed on
Oct 30, 2006
Sold by
Gmac Mortgage Corp
Bought by
Hud
Purchase Details
Closed on
Jun 23, 2005
Sold by
Vallery Thomas S and Vallery Amanda M
Bought by
Helke Jeffrey L and Helke Kimberly M
Home Financials for this Owner
Home Financials are based on the most recent Mortgage that was taken out on this home.
Original Mortgage
$151,620
Interest Rate
5.86%
Mortgage Type
FHA
Purchase Details
Closed on
Oct 16, 1998
Sold by
Snyder John E and Snyder Delores J
Bought by
Vallery Thomas S and Vallery Amanda M
Create a Home Valuation Report for This Property
The Home Valuation Report is an in-depth analysis detailing your home's value as well as a comparison with similar homes in the area
Home Values in the Area
Average Home Value in this Area
Purchase History
| Date | Buyer | Sale Price | Title Company |
|---|---|---|---|
| Blakley Aaron | $61,000 | Lakeside Title & Escrow Agen | |
| Gmac Mortgage Corp | $163,892 | None Available | |
| Hud | -- | Attorney | |
| Helke Jeffrey L | $165,150 | -- | |
| Vallery Thomas S | $115,000 | -- | |
| Vallery Thomas S | $115,000 | -- |
Source: Public Records
Mortgage History
| Date | Status | Borrower | Loan Amount |
|---|---|---|---|
| Previous Owner | Helke Jeffrey L | $151,620 |
Source: Public Records
Tax History Compared to Growth
Tax History
| Year | Tax Paid | Tax Assessment Tax Assessment Total Assessment is a certain percentage of the fair market value that is determined by local assessors to be the total taxable value of land and additions on the property. | Land | Improvement |
|---|---|---|---|---|
| 2024 | $1,931 | $72,320 | $27,380 | $44,940 |
| 2023 | $1,931 | $72,320 | $27,380 | $44,940 |
| 2022 | $3,790 | $57,400 | $21,730 | $35,670 |
| 2021 | $3,793 | $57,400 | $21,730 | $35,670 |
| 2020 | $3,782 | $57,400 | $21,730 | $35,670 |
| 2019 | $3,536 | $49,180 | $21,730 | $27,450 |
| 2018 | $3,542 | $49,180 | $21,730 | $27,450 |
| 2017 | $3,518 | $49,180 | $21,730 | $27,450 |
| 2016 | $3,532 | $49,710 | $21,730 | $27,980 |
| 2015 | $3,488 | $49,710 | $21,730 | $27,980 |
| 2014 | $3,488 | $49,710 | $21,730 | $27,980 |
| 2012 | -- | $46,170 | $15,360 | $30,810 |
Source: Public Records
Map
Nearby Homes
- 1515 Ash Ridge Ct
- 1441 S Dixie Dr
- 246 Crest Hill Ave
- 1052 Forest Crest Place
- 1054 Wilhelmina Dr
- 917 Howard Ln
- 696 W Alkaline Springs Rd
- 1588 Middle Park Dr
- 416 Bent Twig Dr
- 469 Farrell Rd
- 461 Poplar Grove Dr
- 485 Pilot Point Unit 1-301
- 3518 Park Crest Ln
- 612 Bennert Dr
- 3600 Little York Rd
- 770 Deer Creek Dr
- 1201 Greystone Cir
- 1018 Marcellus Dr
- 3370 Hertlein Ln
- 847 Waldsmith Way
- 343 Stonequarry Rd
- 295 Stonequarry Rd
- 363 Stonequarry Rd
- 1502 Ashworth Dr
- 265 Stonequarry Rd
- 383 Stonequarry Rd
- 342 Woodland Meadows Dr
- 3882 Stonequarry Rd
- 368 Woodland Meadows Dr
- 1518 Ashworth Dr
- 321 Woodland Meadows Dr
- 419 Stonequarry Rd
- 390 Woodland Meadows Dr
- 1534 Ashworth Dr
- 1509 Ashworth Dr
- 404 Woodland Meadows Dr
- 211 Stonequarry Rd
- 349 Woodland Meadows Dr
- 415 Ashbury Farms Dr
- 1556 Ashworth Dr