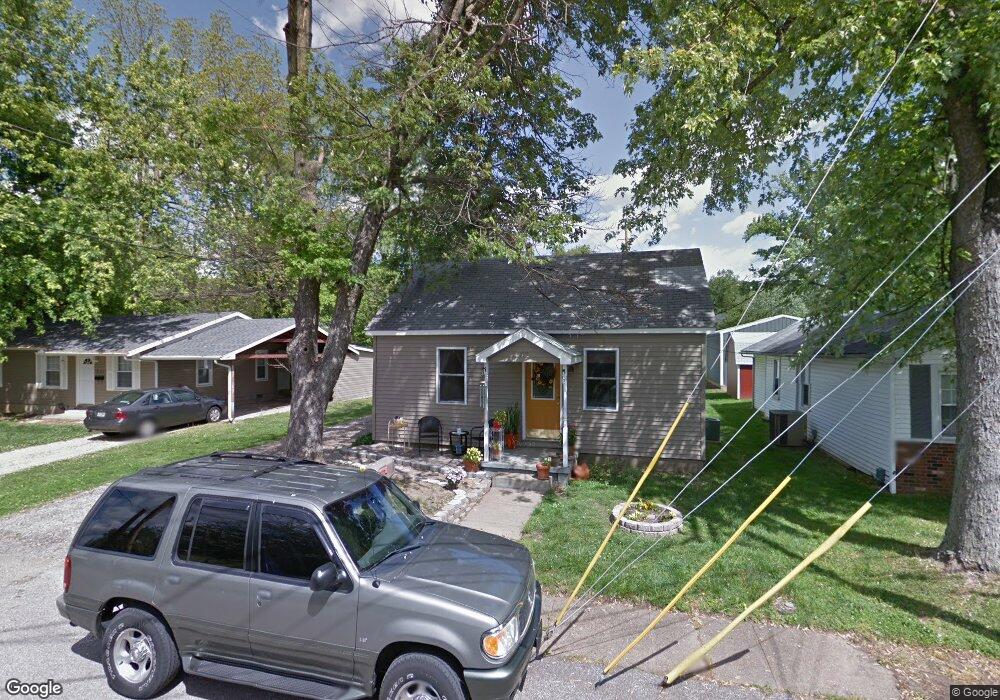
319 Sycamore St Newburgh, IN 47630
Estimated Value: $107,000 - $158,000
2
Beds
1
Bath
725
Sq Ft
$185/Sq Ft
Est. Value
About This Home
This home is located at 319 Sycamore St, Newburgh, IN 47630 and is currently estimated at $134,409, approximately $185 per square foot. 319 Sycamore St is a home located in Warrick County with nearby schools including Newburgh Elementary School, Castle North Middle School, and Castle High School.
Ownership History
Date
Name
Owned For
Owner Type
Purchase Details
Closed on
Jun 10, 2013
Sold by
Fisher James C and Fisher Kathryn L
Bought by
Mcmanus Mary Leee
Current Estimated Value
Home Financials for this Owner
Home Financials are based on the most recent Mortgage that was taken out on this home.
Original Mortgage
$57,000
Outstanding Balance
$40,438
Interest Rate
3.43%
Mortgage Type
New Conventional
Estimated Equity
$93,971
Create a Home Valuation Report for This Property
The Home Valuation Report is an in-depth analysis detailing your home's value as well as a comparison with similar homes in the area
Home Values in the Area
Average Home Value in this Area
Purchase History
| Date | Buyer | Sale Price | Title Company |
|---|---|---|---|
| Mcmanus Mary Leee | -- | None Available |
Source: Public Records
Mortgage History
| Date | Status | Borrower | Loan Amount |
|---|---|---|---|
| Open | Mcmanus Mary Leee | $57,000 |
Source: Public Records
Tax History Compared to Growth
Tax History
| Year | Tax Paid | Tax Assessment Tax Assessment Total Assessment is a certain percentage of the fair market value that is determined by local assessors to be the total taxable value of land and additions on the property. | Land | Improvement |
|---|---|---|---|---|
| 2024 | $578 | $95,100 | $36,600 | $58,500 |
| 2023 | $532 | $93,500 | $36,600 | $56,900 |
| 2022 | $326 | $73,400 | $11,700 | $61,700 |
| 2021 | $285 | $58,700 | $9,600 | $49,100 |
| 2020 | $302 | $61,500 | $9,600 | $51,900 |
| 2019 | $303 | $61,500 | $9,600 | $51,900 |
| 2018 | $295 | $60,100 | $9,600 | $50,500 |
| 2017 | $289 | $58,400 | $9,600 | $48,800 |
| 2016 | $288 | $58,200 | $9,600 | $48,600 |
| 2014 | $269 | $59,500 | $9,300 | $50,200 |
| 2013 | $266 | $60,200 | $9,300 | $50,900 |
Source: Public Records
Map
Nearby Homes
- 405 Middle St
- 210 E Main St
- 116 Sycamore St
- 318 E Main St
- 101 E Jennings St Unit E
- 110 Monroe St
- 519 Monroe St
- 709 Cypress St
- 223 W Jennings St
- 422 W Water St
- 806 Treelane Dr
- 5599 Victoria Ct
- 1060 Jefferson Ct
- 5610 Saint Catherine Ct
- 0 Phelps Dr
- 6288 Sycamore Hollow
- 5944 Riceland Dr
- 1 Hillside Trail
- 7711 Woodland Dr
- 8634 Briarose Ct
- 321 Sycamore St
- 315 Sycamore St
- 311 Sycamore St
- 318 Sycamore St
- 316 Locust St
- 335 Sycamore St
- 314 Sycamore St
- 310 Locust St
- 328 Sycamore St
- 334 Locust St
- 307 Sycamore St
- 306 Locust St
- 410 Sycamore St
- 306 Sycamore St
- 301 Sycamore St
- 206 E Gray St
- 401 Sycamore St
- 114 E Gray St
- 218 E Gray St
- 319 Middle St