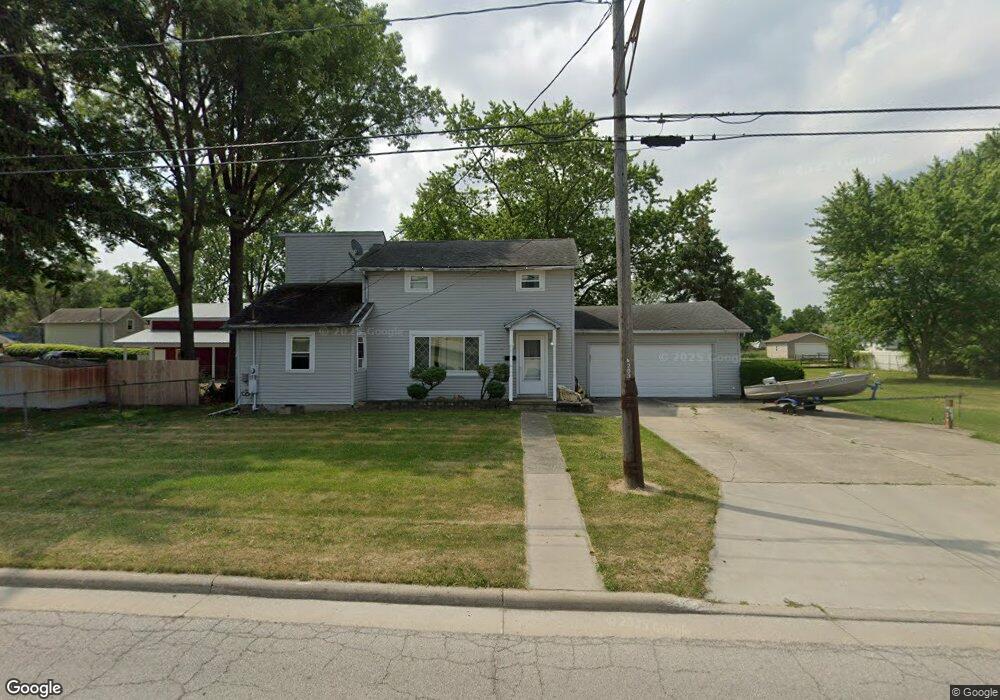
319 Sycamore St Wauseon, OH 43567
Estimated Value: $144,000 - $170,000
3
Beds
2
Baths
1,843
Sq Ft
$86/Sq Ft
Est. Value
About This Home
This home is located at 319 Sycamore St, Wauseon, OH 43567 and is currently estimated at $158,418, approximately $85 per square foot. 319 Sycamore St is a home located in Fulton County with nearby schools including Wauseon Primary School, Wauseon Elementary School, and Wauseon Middle School.
Ownership History
Date
Name
Owned For
Owner Type
Purchase Details
Closed on
Sep 1, 2010
Sold by
Fannie Mae
Bought by
Wines Christopher R
Current Estimated Value
Purchase Details
Closed on
Oct 6, 2009
Sold by
Mcfarlen Edward J
Bought by
Federal National Mortgage Association
Purchase Details
Closed on
May 11, 2004
Sold by
Smith John A and Smith Nancy M
Bought by
Mcfarlen Edward J
Home Financials for this Owner
Home Financials are based on the most recent Mortgage that was taken out on this home.
Original Mortgage
$85,000
Interest Rate
5.5%
Mortgage Type
Purchase Money Mortgage
Purchase Details
Closed on
Mar 25, 2003
Sold by
Hud
Bought by
Smith John A and Smith Nancy M
Home Financials for this Owner
Home Financials are based on the most recent Mortgage that was taken out on this home.
Original Mortgage
$64,200
Interest Rate
5.94%
Mortgage Type
Purchase Money Mortgage
Purchase Details
Closed on
Jan 1, 1990
Bought by
Wotring Jerold L
Create a Home Valuation Report for This Property
The Home Valuation Report is an in-depth analysis detailing your home's value as well as a comparison with similar homes in the area
Home Values in the Area
Average Home Value in this Area
Purchase History
| Date | Buyer | Sale Price | Title Company |
|---|---|---|---|
| Wines Christopher R | $45,000 | None Available | |
| Federal National Mortgage Association | $78,600 | None Available | |
| Mcfarlen Edward J | $85,000 | -- | |
| Smith John A | $55,500 | Lakeside Title & Escrow Agen | |
| Wotring Jerold L | -- | -- |
Source: Public Records
Mortgage History
| Date | Status | Borrower | Loan Amount |
|---|---|---|---|
| Previous Owner | Mcfarlen Edward J | $85,000 | |
| Previous Owner | Smith John A | $64,200 |
Source: Public Records
Tax History Compared to Growth
Tax History
| Year | Tax Paid | Tax Assessment Tax Assessment Total Assessment is a certain percentage of the fair market value that is determined by local assessors to be the total taxable value of land and additions on the property. | Land | Improvement |
|---|---|---|---|---|
| 2024 | $1,971 | $39,660 | $9,840 | $29,820 |
| 2023 | $1,971 | $39,660 | $9,840 | $29,820 |
| 2022 | $1,770 | $30,280 | $8,190 | $22,090 |
| 2021 | $1,882 | $30,280 | $8,190 | $22,090 |
| 2020 | $1,739 | $30,280 | $8,190 | $22,090 |
| 2019 | $1,693 | $29,050 | $8,190 | $20,860 |
| 2018 | $1,498 | $29,050 | $8,190 | $20,860 |
| 2017 | $1,480 | $29,050 | $8,190 | $20,860 |
| 2016 | $1,452 | $25,660 | $8,190 | $17,470 |
| 2015 | $1,361 | $25,660 | $8,190 | $17,470 |
| 2014 | $1,294 | $25,660 | $8,190 | $17,470 |
| 2013 | $1,525 | $27,970 | $7,000 | $20,970 |
Source: Public Records
Map
Nearby Homes
- 428 N Brunell St
- 227 Wabash St
- 351 E Walnut St
- 234 W Chestnut St
- 252 W Chestnut St
- 217 Marshall St
- 139 Marshall St
- 125 Cherry St
- 524 E Elm St
- 527 E Elm St
- 420 Clover Ln
- 622 Vine St
- 00 Glenwood
- 0 Glenwood Unit 6124946
- 303 Eastwood St
- 1270 S Park Ln
- 744 Fairway Dr
- 660 Parkside Dr
- 720 Parkside Dr
- 1338 N Park Ln
- 329 Sycamore St
- 305 Sycamore St
- 335 Sycamore St
- 439 Potter St
- 339 Sycamore St
- 435 Potter St
- 427 Potter St
- 450 N Brunell St
- 421 Potter St
- 424 N Brunell St
- 450 Potter St
- 244 Sycamore St
- 420 N Brunell St
- 444 Potter St
- 415 Potter St
- 438 Potter St
- 240 Sycamore St
- 406 N Brunell St
- 432 Potter St
- 227 Sycamore St