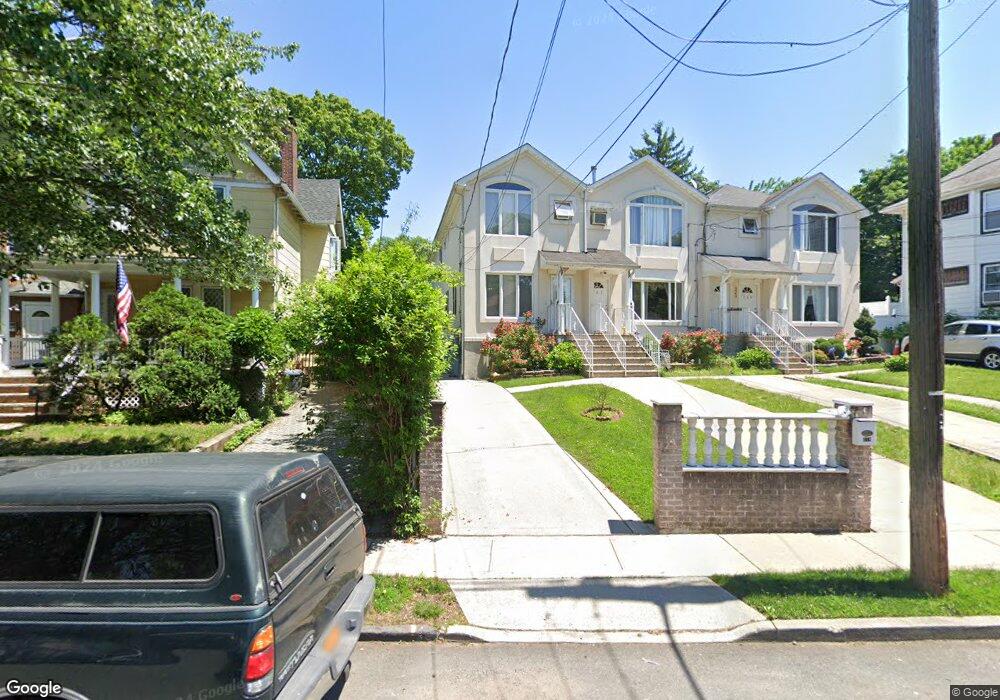
319 Taylor St Staten Island, NY 10310
West Brighton NeighborhoodEstimated Value: $571,000 - $758,000
3
Beds
4
Baths
1,530
Sq Ft
$436/Sq Ft
Est. Value
About This Home
This home is located at 319 Taylor St, Staten Island, NY 10310 and is currently estimated at $667,840, approximately $436 per square foot. 319 Taylor St is a home located in Richmond County with nearby schools including P.S. 19 The Curtis School, Intermediate School 27, and Susan E Wagner High School.
Ownership History
Date
Name
Owned For
Owner Type
Purchase Details
Closed on
Jan 10, 2024
Sold by
Delgado Nudia M
Bought by
Wickremaratne Kapugamage Channa
Current Estimated Value
Home Financials for this Owner
Home Financials are based on the most recent Mortgage that was taken out on this home.
Original Mortgage
$230,000
Outstanding Balance
$225,975
Interest Rate
6.95%
Mortgage Type
New Conventional
Estimated Equity
$441,865
Purchase Details
Closed on
Sep 26, 2006
Sold by
Richmond Realty Development Inc
Bought by
Delgado Nudia M
Home Financials for this Owner
Home Financials are based on the most recent Mortgage that was taken out on this home.
Original Mortgage
$344,000
Interest Rate
6.75%
Mortgage Type
New Conventional
Purchase Details
Closed on
Sep 7, 2004
Sold by
Sims Howard
Bought by
Richmond Realty Development Inc
Create a Home Valuation Report for This Property
The Home Valuation Report is an in-depth analysis detailing your home's value as well as a comparison with similar homes in the area
Home Values in the Area
Average Home Value in this Area
Purchase History
| Date | Buyer | Sale Price | Title Company |
|---|---|---|---|
| Wickremaratne Kapugamage Channa | $552,000 | Old Republic National Title In | |
| Delgado Nudia M | $436,020 | Fidelity National Title Insu | |
| Richmond Realty Development Inc | $500,000 | Chicago Title Insurance Co |
Source: Public Records
Mortgage History
| Date | Status | Borrower | Loan Amount |
|---|---|---|---|
| Open | Wickremaratne Kapugamage Channa | $230,000 | |
| Previous Owner | Delgado Nudia M | $344,000 |
Source: Public Records
Tax History Compared to Growth
Tax History
| Year | Tax Paid | Tax Assessment Tax Assessment Total Assessment is a certain percentage of the fair market value that is determined by local assessors to be the total taxable value of land and additions on the property. | Land | Improvement |
|---|---|---|---|---|
| 2025 | $4,491 | $41,940 | $4,360 | $37,580 |
| 2024 | $4,772 | $34,920 | $4,940 | $29,980 |
| 2023 | $4,541 | $23,760 | $5,304 | $18,456 |
| 2022 | $4,420 | $28,500 | $7,260 | $21,240 |
| 2021 | $4,379 | $30,060 | $7,260 | $22,800 |
| 2020 | $4,147 | $27,000 | $7,260 | $19,740 |
| 2019 | $3,849 | $26,100 | $7,260 | $18,840 |
| 2018 | $3,739 | $19,800 | $6,458 | $13,342 |
| 2017 | $3,706 | $19,651 | $5,595 | $14,056 |
| 2016 | $3,396 | $18,539 | $5,498 | $13,041 |
| 2015 | $2,884 | $17,490 | $5,353 | $12,137 |
| 2014 | $2,884 | $16,500 | $6,060 | $10,440 |
Source: Public Records
Map
Nearby Homes
- 321 Taylor St
- 317 Taylor St
- 323 Taylor St Unit 325
- 323-325 Taylor St
- 315 Taylor St
- 313 Taylor St
- 331 Taylor St
- 311 Taylor St
- 122 Roe St
- 128 Roe St
- 126 Roe St Unit 2
- 126 Roe St Unit 3
- 126 Roe St
- 305 Taylor St
- 120 Roe St
- 335 Taylor St
- 132 1/2-13 Roe St
- 132 Roe St Unit 134
- 132 Roe St
- 132 Roe St Unit 1/2