Estimated Value: $640,000 - $700,000
Studio
3
Baths
3,368
Sq Ft
$202/Sq Ft
Est. Value
About This Home
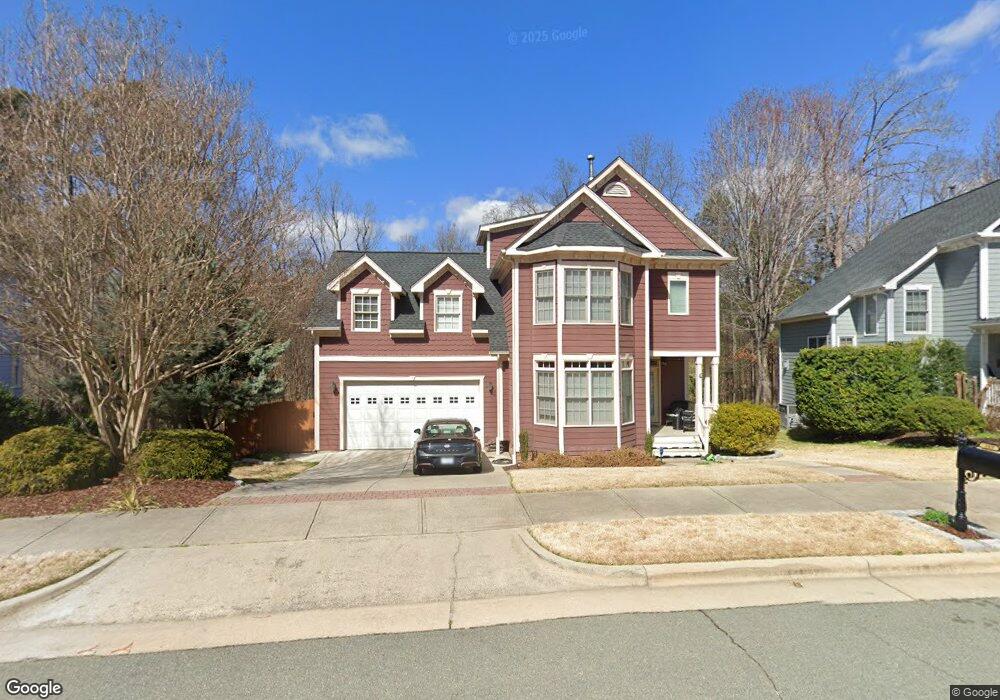
This home is located at 319 Village Loop Dr, Apex, NC 27502 and is currently estimated at $681,154, approximately $202 per square foot. 319 Village Loop Dr is a home located in Wake County with nearby schools including Scotts Ridge Elementary School, Apex Middle, and Apex High School.
Ownership History
Date
Name
Owned For
Owner Type
Purchase Details
Closed on
Nov 21, 2023
Sold by
Antonio Michelle T
Bought by
Michelle Antonio Living Trust and Antonio
Current Estimated Value
Purchase Details
Closed on
Jul 12, 2021
Sold by
Antonio Michelle T and Antonio Brett M
Bought by
Antonio Michelle T
Purchase Details
Closed on
Jul 12, 2002
Sold by
Biltmore Homes Llc
Bought by
Antonio Brett M and Antonio Michelle T
Home Financials for this Owner
Home Financials are based on the most recent Mortgage that was taken out on this home.
Original Mortgage
$193,000
Interest Rate
6.49%
Mortgage Type
Stand Alone First
Create a Home Valuation Report for This Property
The Home Valuation Report is an in-depth analysis detailing your home's value as well as a comparison with similar homes in the area
Purchase History
| Date | Buyer | Sale Price | Title Company |
|---|---|---|---|
| Michelle Antonio Living Trust | -- | None Listed On Document | |
| Antonio Michelle T | -- | None Available | |
| Antonio Brett M | $267,000 | -- |
Source: Public Records
Mortgage History
| Date | Status | Borrower | Loan Amount |
|---|---|---|---|
| Previous Owner | Antonio Brett M | $193,000 |
Source: Public Records
Tax History
| Year | Tax Paid | Tax Assessment Tax Assessment Total Assessment is a certain percentage of the fair market value that is determined by local assessors to be the total taxable value of land and additions on the property. | Land | Improvement |
|---|---|---|---|---|
| 2025 | $5,614 | $640,672 | $138,000 | $502,672 |
| 2024 | $5,488 | $640,672 | $138,000 | $502,672 |
Source: Public Records
Map
Nearby Homes
- 400 Village Loop Dr
- 440 Oak Pine Dr
- 470 Magdala Place
- 107 Maple Crest Ct
- 1913 Metta Mill Ln
- 0 Jb Morgan Rd Unit 10051948
- 1818 Porch Swing Way
- 1224 Tartarian Trail
- 1303 Goldspot Ct
- 1216 Scotts Ridge Trail
- 1880 Woodall Crest Dr
- 1006 Cherokee Sunset Rd
- 1838 Woodall Crest Dr
- 1866 Porch Swing Way
- 1050 Scotts Ridge Trail
- 1047 Mica Lamp Ct
- 3021 White Cloud Cir
- 101 Rocklyn Ln
- 1314 Chenworth Dr
- 1008 Daresbury Dr
- 321 Village Loop Dr
- 317 Village Loop Dr
- 323 Village Loop Dr
- 315 Village Loop Dr
- 320 Village Loop Dr
- 318 Village Loop Dr
- 316 Village Loop Dr
- 322 Village Loop Dr
- 325 Village Loop Dr
- 313 Village Loop Dr
- 312 Village Loop Dr
- 401 Village Loop Dr
- 402 Village Loop Dr
- 310 Village Loop Dr
- 311 Village Loop Dr
- 403 Village Loop Dr
- 401 Village Commons Ln
- 306 Village Loop Dr
- 0 Village Commons Ave Unit TR1900201
- 0 Village Commons Ave Unit TR1898614
Your Personal Tour Guide
Ask me questions while you tour the home.