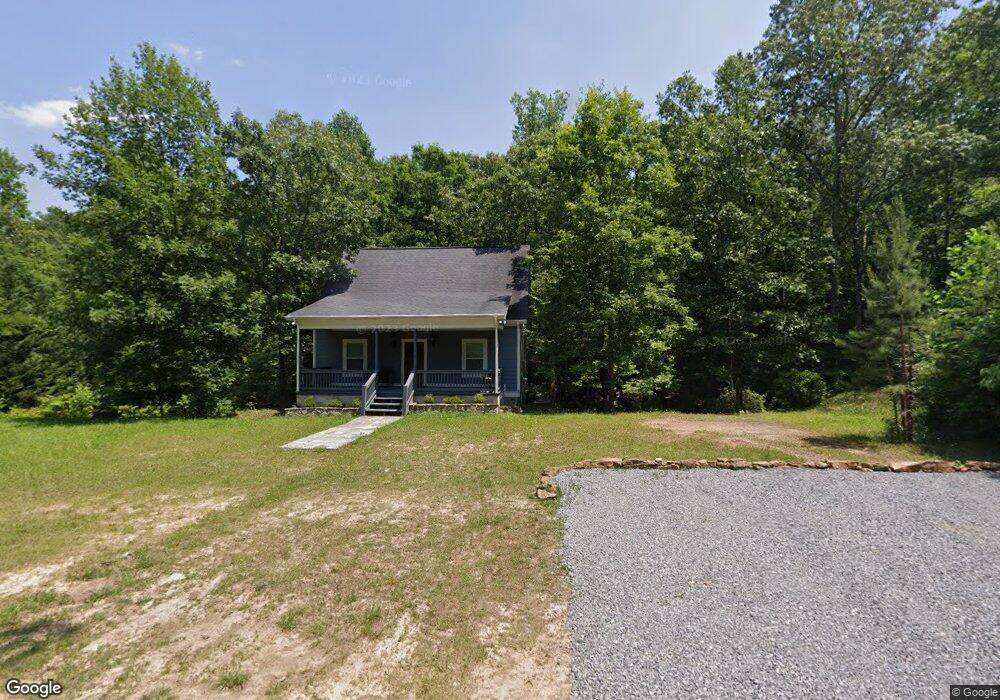
319 Vulcan Dr Rising Fawn, GA 30738
Hinkles NeighborhoodEstimated Value: $302,851 - $439,000
--
Bed
--
Bath
1,792
Sq Ft
$213/Sq Ft
Est. Value
About This Home
This home is located at 319 Vulcan Dr, Rising Fawn, GA 30738 and is currently estimated at $382,463, approximately $213 per square foot. 319 Vulcan Dr is a home with nearby schools including Fairyland Elementary School, Chattanooga Valley Middle School, and Ridgeland High School.
Ownership History
Date
Name
Owned For
Owner Type
Purchase Details
Closed on
Aug 1, 2018
Sold by
Richardson Troy
Bought by
Thompson James D and Thompson Sue Ellen
Current Estimated Value
Home Financials for this Owner
Home Financials are based on the most recent Mortgage that was taken out on this home.
Original Mortgage
$161,782
Outstanding Balance
$141,620
Interest Rate
4.87%
Mortgage Type
FHA
Estimated Equity
$240,843
Purchase Details
Closed on
May 21, 2013
Sold by
Noblitt Anthony Todd
Bought by
Richardson Troy
Purchase Details
Closed on
Apr 7, 2010
Sold by
Hamilton Gayle A
Bought by
Noblitt Anthony Todd
Purchase Details
Closed on
Mar 31, 2006
Sold by
Chattanooga Christian Comm
Bought by
Hamilton Galye A
Purchase Details
Closed on
Mar 30, 2006
Sold by
Not Provided
Bought by
Noblitt Anthony Todd and Noblitt
Purchase Details
Closed on
Feb 27, 2003
Sold by
Smith Nolan E and Smith Joann
Bought by
Austin Thomas A
Purchase Details
Closed on
Jul 16, 1999
Sold by
Cutts Tyson Wayne
Bought by
Smith Nolan E and Smith Joann
Purchase Details
Closed on
Mar 27, 1991
Sold by
Mcnabb David Scott
Bought by
Cutts Tyson Wayne
Purchase Details
Closed on
Jan 1, 1972
Bought by
Mcnabb David Scott
Create a Home Valuation Report for This Property
The Home Valuation Report is an in-depth analysis detailing your home's value as well as a comparison with similar homes in the area
Home Values in the Area
Average Home Value in this Area
Purchase History
| Date | Buyer | Sale Price | Title Company |
|---|---|---|---|
| Thompson James D | $166,000 | -- | |
| Richardson Troy | $24,000 | -- | |
| Noblitt Anthony Todd | $20,000 | -- | |
| Hamilton Galye A | $43,000 | -- | |
| Chattanooga Christian Communit | $43,000 | -- | |
| Noblitt Anthony Todd | $43,000 | -- | |
| Austin Thomas A | $15,000 | -- | |
| Smith Nolan E | -- | -- | |
| Cutts Tyson Wayne | $51,400 | -- | |
| Mcnabb David Scott | -- | -- |
Source: Public Records
Mortgage History
| Date | Status | Borrower | Loan Amount |
|---|---|---|---|
| Open | Thompson James D | $161,782 |
Source: Public Records
Tax History Compared to Growth
Tax History
| Year | Tax Paid | Tax Assessment Tax Assessment Total Assessment is a certain percentage of the fair market value that is determined by local assessors to be the total taxable value of land and additions on the property. | Land | Improvement |
|---|---|---|---|---|
| 2024 | $2,650 | $118,106 | $10,933 | $107,173 |
| 2023 | $2,553 | $111,132 | $9,762 | $101,370 |
| 2022 | $2,162 | $85,369 | $2,264 | $83,105 |
| 2021 | $2,066 | $73,390 | $2,264 | $71,126 |
| 2020 | $1,722 | $57,823 | $2,264 | $55,559 |
| 2019 | $1,753 | $57,823 | $2,264 | $55,559 |
| 2018 | $924 | $34,927 | $4,441 | $30,486 |
| 2017 | $1,274 | $36,518 | $4,441 | $32,077 |
| 2016 | $693 | $23,002 | $4,441 | $18,561 |
| 2015 | $545 | $20,934 | $3,028 | $17,906 |
| 2014 | -- | $20,934 | $3,028 | $17,906 |
| 2013 | -- | $3,028 | $3,028 | $0 |
Source: Public Records
Map
Nearby Homes
- 0 Still Creek Rd Unit 1397590
- 0 Still Creek Rd Unit 1397587
- 0 Ridley Cir
- 5031 Highway 157
- 0 Payne Chapel Rd Unit RTC3014901
- 0 Payne Chapel Rd Unit 1522156
- 8442 Scenic Hwy
- 1573 Highway 157
- 8761 Scenic Hwy
- 8 Cosmic Way
- 168 Middle Rd
- 0 Lookout Crest Ln Unit RTC2484643
- 0 Lookout Crest Ln Unit 1368395
- 331 Brow Lake Rd
- 2070 Creek Rd
- 697 N Stewart Ln
- 1854 Powder Springs Cir
- 7820 Highway 193
- 5432 Scenic Hwy
- 857 Williams Rd