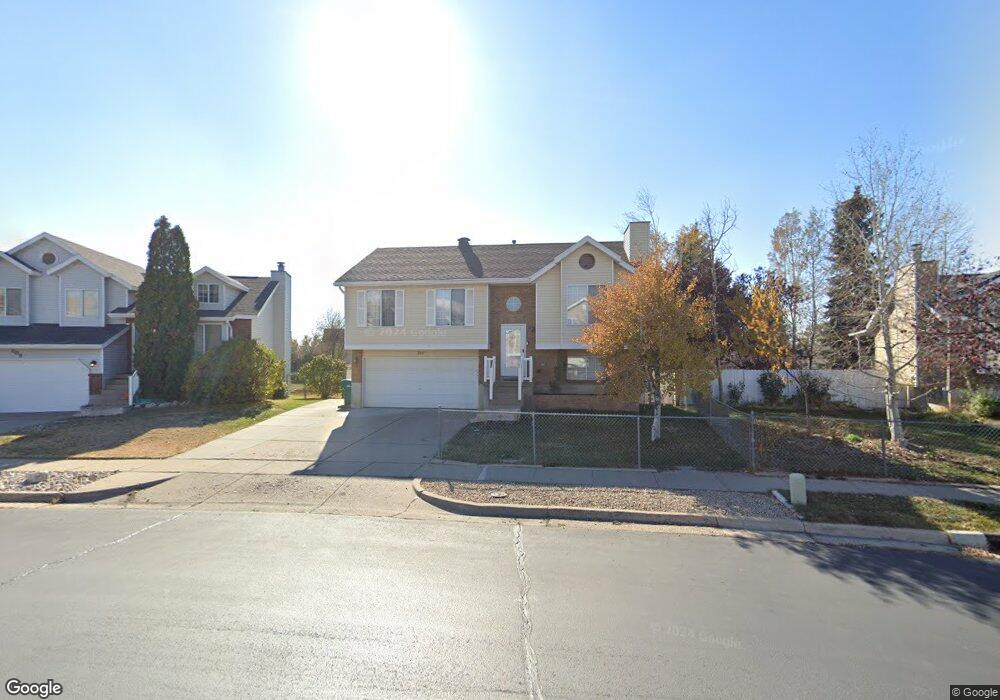
319 W 1900 N Layton, UT 84041
Estimated Value: $422,000 - $445,000
3
Beds
2
Baths
1,514
Sq Ft
$288/Sq Ft
Est. Value
About This Home
This home is located at 319 W 1900 N, Layton, UT 84041 and is currently estimated at $436,111, approximately $288 per square foot. 319 W 1900 N is a home located in Davis County with nearby schools including Lincoln Elementary School, North Layton Junior High School, and Northridge High School.
Ownership History
Date
Name
Owned For
Owner Type
Purchase Details
Closed on
May 1, 2018
Sold by
Stone Brandon and Martinez Rebecca Rose
Bought by
Albano Sergio Reyes
Current Estimated Value
Home Financials for this Owner
Home Financials are based on the most recent Mortgage that was taken out on this home.
Original Mortgage
$232,750
Outstanding Balance
$200,161
Interest Rate
4.44%
Mortgage Type
New Conventional
Estimated Equity
$235,950
Purchase Details
Closed on
Sep 25, 2002
Sold by
Ball Eric D and Ball Melinda L
Bought by
Thomas Matthew A and Thomas Delilah
Purchase Details
Closed on
Nov 12, 1998
Sold by
Blackham Carri and Blackham Mike
Bought by
Ball Eric D and Ball Melinda L
Home Financials for this Owner
Home Financials are based on the most recent Mortgage that was taken out on this home.
Original Mortgage
$118,218
Interest Rate
6.54%
Mortgage Type
VA
Purchase Details
Closed on
Jun 18, 1998
Sold by
Welch Jeffrey M and Welch Martha A
Bought by
Blackham Carri and Blackham Mike
Create a Home Valuation Report for This Property
The Home Valuation Report is an in-depth analysis detailing your home's value as well as a comparison with similar homes in the area
Home Values in the Area
Average Home Value in this Area
Purchase History
| Date | Buyer | Sale Price | Title Company |
|---|---|---|---|
| Albano Sergio Reyes | -- | Us Title | |
| Thomas Matthew A | -- | Equity Title Agency | |
| Ball Eric D | -- | First American Title Co | |
| Blackham Carri | $94,000 | -- |
Source: Public Records
Mortgage History
| Date | Status | Borrower | Loan Amount |
|---|---|---|---|
| Open | Albano Sergio Reyes | $232,750 | |
| Previous Owner | Ball Eric D | $118,218 |
Source: Public Records
Tax History Compared to Growth
Tax History
| Year | Tax Paid | Tax Assessment Tax Assessment Total Assessment is a certain percentage of the fair market value that is determined by local assessors to be the total taxable value of land and additions on the property. | Land | Improvement |
|---|---|---|---|---|
| 2025 | $2,023 | $221,650 | $89,910 | $131,740 |
| 2024 | $2,023 | $213,950 | $105,447 | $108,503 |
| 2023 | $2,023 | $377,000 | $131,892 | $245,108 |
| 2022 | $2,087 | $211,200 | $67,764 | $143,436 |
| 2021 | $1,941 | $293,000 | $90,054 | $202,946 |
| 2020 | $1,747 | $253,000 | $77,849 | $175,151 |
| 2019 | $1,685 | $239,000 | $75,880 | $163,120 |
| 2018 | $1,391 | $198,000 | $75,880 | $122,120 |
| 2016 | $1,292 | $94,930 | $22,884 | $72,046 |
| 2015 | $1,241 | $86,515 | $22,884 | $63,631 |
| 2014 | $1,116 | $79,566 | $22,884 | $56,682 |
| 2013 | -- | $82,916 | $20,620 | $62,296 |
Source: Public Records
Map
Nearby Homes
- 247 W 1925 N
- 1837 N 440 W
- 1966 N 50 W
- 2044 Evans Cove Loop
- 2048 Evans Cove Loop
- 1644 N 160 W
- 1676 Forbes Ave W
- 2187 N 450 W
- 2211 N 525 W
- 1490 N 175 W
- 2248 N 500 W
- 23 E 2150 N
- 160 W 1350 N
- 1553 N 250 E
- 255 E 1500 N
- 2378 N 675 W
- 2402 N 725 W
- 2500 N Fort Ln Unit 238
- 2500 N Fort Ln Unit 189
- 2600 N Hill Field Rd Unit 4