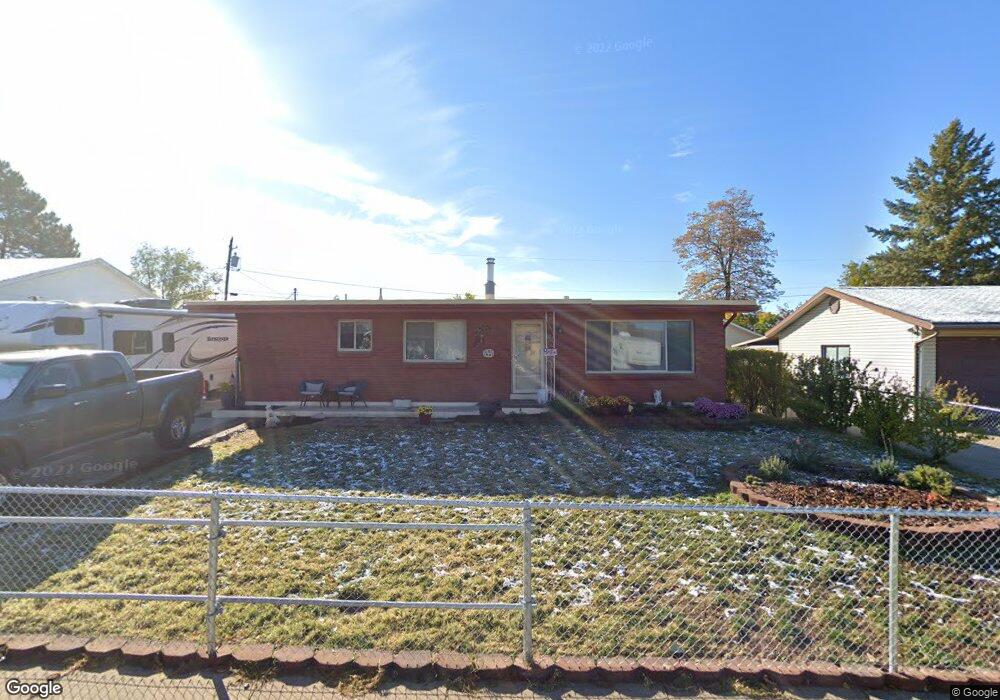
319 W 870 N Clearfield, UT 84015
Estimated Value: $378,000 - $405,000
5
Beds
2
Baths
2,296
Sq Ft
$172/Sq Ft
Est. Value
About This Home
This home is located at 319 W 870 N, Clearfield, UT 84015 and is currently estimated at $394,944, approximately $172 per square foot. 319 W 870 N is a home located in Davis County with nearby schools including Doxey School, Sunset Junior High School, and Northridge High School.
Ownership History
Date
Name
Owned For
Owner Type
Purchase Details
Closed on
Apr 24, 2000
Sold by
Zorko Rudolph
Bought by
Quick Carl R and Quick Teresa A
Current Estimated Value
Home Financials for this Owner
Home Financials are based on the most recent Mortgage that was taken out on this home.
Original Mortgage
$133,068
Outstanding Balance
$45,390
Interest Rate
8.38%
Mortgage Type
FHA
Estimated Equity
$349,554
Purchase Details
Closed on
Mar 31, 2000
Sold by
Zorko Teri E
Bought by
Quick Carl R and Quick Teresa A
Home Financials for this Owner
Home Financials are based on the most recent Mortgage that was taken out on this home.
Original Mortgage
$133,068
Outstanding Balance
$45,390
Interest Rate
8.38%
Mortgage Type
FHA
Estimated Equity
$349,554
Purchase Details
Closed on
Mar 6, 2000
Sold by
Zorko Teri
Bought by
Zorko Teri E and Zorko Rudolph
Home Financials for this Owner
Home Financials are based on the most recent Mortgage that was taken out on this home.
Original Mortgage
$133,068
Outstanding Balance
$45,390
Interest Rate
8.38%
Mortgage Type
FHA
Estimated Equity
$349,554
Create a Home Valuation Report for This Property
The Home Valuation Report is an in-depth analysis detailing your home's value as well as a comparison with similar homes in the area
Home Values in the Area
Average Home Value in this Area
Purchase History
| Date | Buyer | Sale Price | Title Company |
|---|---|---|---|
| Quick Carl R | -- | Mountain View Title & Escrow | |
| Quick Carl R | -- | Mountain View Title & Escrow | |
| Zorko Teri E | -- | Mountain View Title & Escrow | |
| Zorko Teri | -- | Mountain View Title & Escrow |
Source: Public Records
Mortgage History
| Date | Status | Borrower | Loan Amount |
|---|---|---|---|
| Open | Quick Carl R | $133,068 |
Source: Public Records
Tax History Compared to Growth
Tax History
| Year | Tax Paid | Tax Assessment Tax Assessment Total Assessment is a certain percentage of the fair market value that is determined by local assessors to be the total taxable value of land and additions on the property. | Land | Improvement |
|---|---|---|---|---|
| 2025 | $2,352 | $214,500 | $72,885 | $141,615 |
| 2024 | $2,122 | $193,600 | $69,677 | $123,923 |
| 2023 | $1,984 | $330,000 | $111,447 | $218,553 |
| 2022 | $2,126 | $191,400 | $63,875 | $127,525 |
| 2021 | $1,816 | $257,000 | $68,064 | $188,936 |
| 2020 | $1,595 | $222,000 | $57,289 | $164,711 |
| 2019 | $1,521 | $217,000 | $74,017 | $142,983 |
| 2018 | $1,360 | $190,000 | $59,151 | $130,849 |
| 2016 | $1,188 | $85,250 | $27,963 | $57,287 |
| 2015 | $1,117 | $75,955 | $27,963 | $47,992 |
| 2014 | $1,080 | $75,034 | $28,159 | $46,875 |
| 2013 | -- | $69,430 | $23,265 | $46,165 |
Source: Public Records
Map
Nearby Homes