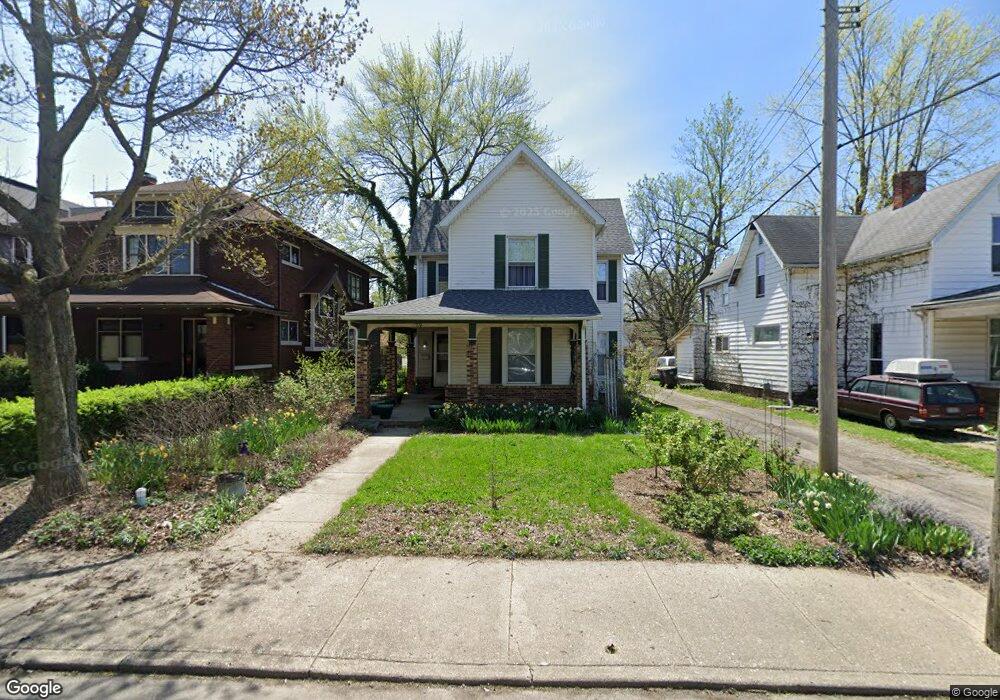
319 W 9th St Anderson, IN 46016
Estimated Value: $125,000 - $197,000
5
Beds
2
Baths
2,492
Sq Ft
$66/Sq Ft
Est. Value
About This Home
This home is located at 319 W 9th St, Anderson, IN 46016 and is currently estimated at $164,420, approximately $65 per square foot. 319 W 9th St is a home located in Madison County with nearby schools including Tenth Street Elementary School, Highland Middle School, and Anderson High School.
Ownership History
Date
Name
Owned For
Owner Type
Purchase Details
Closed on
Mar 15, 2010
Sold by
American Housing Realty Llc
Bought by
Lewis Stephen R
Current Estimated Value
Home Financials for this Owner
Home Financials are based on the most recent Mortgage that was taken out on this home.
Original Mortgage
$63,822
Outstanding Balance
$42,867
Interest Rate
5.25%
Mortgage Type
FHA
Estimated Equity
$121,553
Purchase Details
Closed on
Mar 23, 2009
Sold by
Tinney David L
Bought by
American Housing Realty Llc
Purchase Details
Closed on
Dec 23, 2008
Sold by
Fannie Mae
Bought by
Tinney David L
Create a Home Valuation Report for This Property
The Home Valuation Report is an in-depth analysis detailing your home's value as well as a comparison with similar homes in the area
Home Values in the Area
Average Home Value in this Area
Purchase History
| Date | Buyer | Sale Price | Title Company |
|---|---|---|---|
| Lewis Stephen R | -- | -- | |
| American Housing Realty Llc | -- | -- | |
| Tinney David L | -- | -- |
Source: Public Records
Mortgage History
| Date | Status | Borrower | Loan Amount |
|---|---|---|---|
| Open | Lewis Stephen R | $63,822 |
Source: Public Records
Tax History Compared to Growth
Tax History
| Year | Tax Paid | Tax Assessment Tax Assessment Total Assessment is a certain percentage of the fair market value that is determined by local assessors to be the total taxable value of land and additions on the property. | Land | Improvement |
|---|---|---|---|---|
| 2024 | $820 | $77,700 | $17,600 | $60,100 |
| 2023 | $756 | $71,500 | $16,700 | $54,800 |
| 2022 | $717 | $71,400 | $16,000 | $55,400 |
| 2021 | $693 | $65,800 | $15,900 | $49,900 |
| 2020 | $654 | $62,600 | $15,100 | $47,500 |
| 2019 | $650 | $61,600 | $15,100 | $46,500 |
| 2018 | $610 | $57,300 | $15,100 | $42,200 |
| 2017 | $566 | $57,000 | $15,100 | $41,900 |
| 2016 | $555 | $57,000 | $15,100 | $41,900 |
| 2014 | $501 | $56,100 | $15,000 | $41,100 |
| 2013 | $501 | $56,100 | $15,000 | $41,100 |
Source: Public Records
Map
Nearby Homes