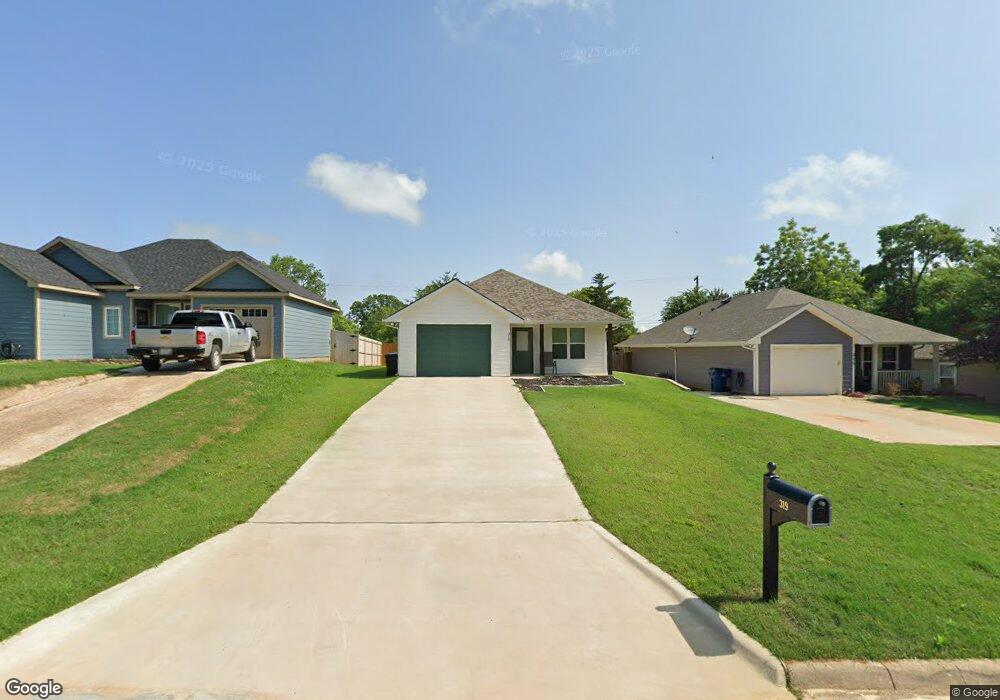
319 W Bond St Denison, TX 75020
Estimated Value: $233,660 - $297,000
3
Beds
2
Baths
1,250
Sq Ft
$212/Sq Ft
Est. Value
About This Home
This home is located at 319 W Bond St, Denison, TX 75020 and is currently estimated at $265,330, approximately $212 per square foot. 319 W Bond St is a home located in Grayson County with nearby schools including Terrell Elementary School, Scott Middle School, and Denison High School.
Ownership History
Date
Name
Owned For
Owner Type
Purchase Details
Closed on
Sep 11, 2020
Sold by
Jbjs Texas Real Estate Llc
Bought by
Thomas Kyle A
Current Estimated Value
Home Financials for this Owner
Home Financials are based on the most recent Mortgage that was taken out on this home.
Original Mortgage
$173,145
Outstanding Balance
$153,655
Interest Rate
2.9%
Mortgage Type
New Conventional
Estimated Equity
$111,675
Purchase Details
Closed on
Jan 29, 2006
Sold by
Moran Ricky
Bought by
Brown Mike
Create a Home Valuation Report for This Property
The Home Valuation Report is an in-depth analysis detailing your home's value as well as a comparison with similar homes in the area
Home Values in the Area
Average Home Value in this Area
Purchase History
| Date | Buyer | Sale Price | Title Company |
|---|---|---|---|
| Thomas Kyle A | -- | Red River Title Co | |
| Brown Mike | -- | None Available |
Source: Public Records
Mortgage History
| Date | Status | Borrower | Loan Amount |
|---|---|---|---|
| Open | Thomas Kyle A | $173,145 |
Source: Public Records
Tax History Compared to Growth
Tax History
| Year | Tax Paid | Tax Assessment Tax Assessment Total Assessment is a certain percentage of the fair market value that is determined by local assessors to be the total taxable value of land and additions on the property. | Land | Improvement |
|---|---|---|---|---|
| 2025 | $4,153 | $254,353 | $45,000 | $209,353 |
| 2024 | $5,472 | $235,518 | $0 | $0 |
| 2023 | $3,525 | $214,107 | $0 | $0 |
| 2022 | $4,625 | $194,643 | $0 | $0 |
| 2021 | $4,463 | $176,948 | $18,750 | $158,198 |
| 2020 | $2,261 | $85,705 | $15,000 | $70,705 |
| 2019 | $241 | $8,775 | $8,775 | $0 |
| 2018 | $144 | $5,175 | $5,175 | $0 |
| 2017 | $76 | $2,700 | $2,700 | $0 |
| 2016 | $46 | $1,650 | $1,650 | $0 |
| 2015 | $0 | $1,650 | $1,650 | $0 |
| 2014 | -- | $1,650 | $1,650 | $0 |
Source: Public Records
Map
Nearby Homes
- 315 W Walker St
- 716 N Rusk Ave
- 205 W Bond St
- 409 W Johnson St
- 425 W Johnson St
- 521 E Fannin E
- 522 N Austin Ave
- 401-403 W Elm St
- 121 W Morton St
- 415 W Elm St Unit 415-417
- 117 W Morton St
- 930 N Mirick Ave
- 110 W Morton St
- 526 W Elm St
- 117 W Sears St
- 105 E Morton St
- 624 W Walker St
- 629 W Walker St
- 410 N Houston Ave
- 610 W Elm St
- 321 W Bond St
- 315 W Bond St
- 327 W Bond St
- 311 W Bond St
- 303 W Bond St
- 314 W Bond St
- 316 W Walker St
- 612 N Burnett Ave
- 520 N Burnett Ave
- 316 W Bond St
- 320 W Bond St
- 310 W Walker St
- 301 W Bond St
- 518 N Burnett Ave
- 308 W Bond St
- 516 N Burnett Ave
- 403 W Bond St
- TBD N Rusk Ave
- 515 N Rusk Ave
- 665 N Rusk Ave