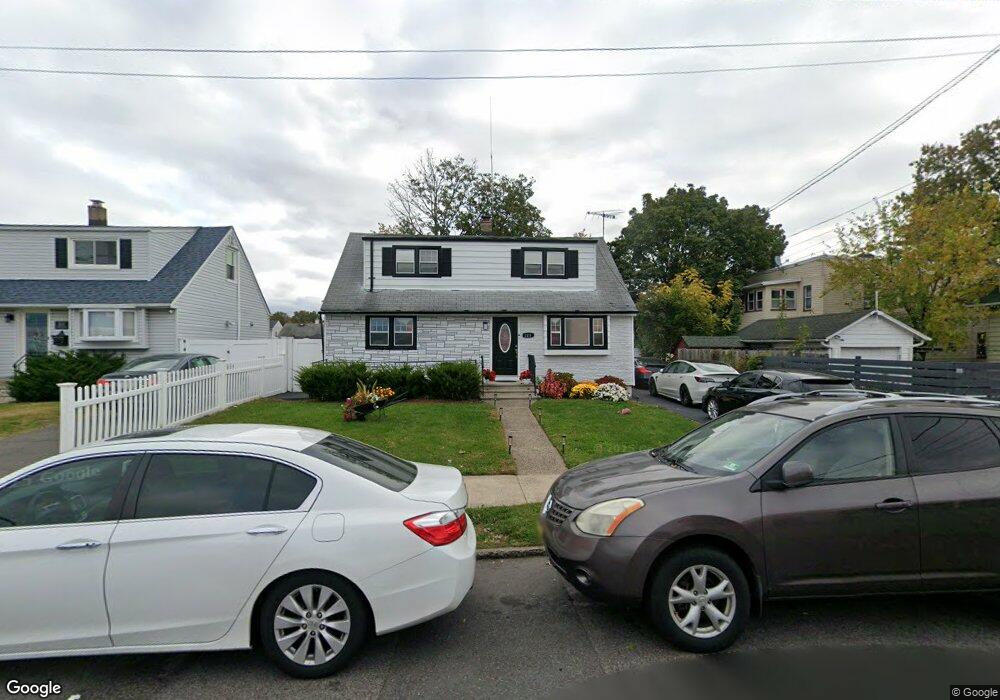
319 Wabash Ave Unit 321 Paterson, NJ 07503
South Paterson NeighborhoodEstimated Value: $511,781 - $561,000
4
Beds
1
Bath
1,550
Sq Ft
$347/Sq Ft
Est. Value
About This Home
This home is located at 319 Wabash Ave Unit 321, Paterson, NJ 07503 and is currently estimated at $537,195, approximately $346 per square foot. 319 Wabash Ave Unit 321 is a home located in Passaic County with nearby schools including Dale Avenue Elementary School, Edward W. Kilpatrick School of Discovery, and Paterson Public School No. 3.
Ownership History
Date
Name
Owned For
Owner Type
Purchase Details
Closed on
Sep 4, 2020
Sold by
Chalas Altagracia and Sanchez Luis E
Bought by
Chalas Altagracia
Current Estimated Value
Purchase Details
Closed on
Feb 26, 2019
Sold by
2017 1 Reo Llc
Bought by
Chalas Altragracia and Sanchez Luis E
Home Financials for this Owner
Home Financials are based on the most recent Mortgage that was taken out on this home.
Original Mortgage
$255,982
Interest Rate
4.4%
Mortgage Type
New Conventional
Purchase Details
Closed on
Nov 28, 2017
Sold by
Fernandez Fernando A and Bayview Loan Servicing Llc
Bought by
2017 1 Reo Llc
Purchase Details
Closed on
Mar 18, 2011
Sold by
Derose Donald E and De Rose Carol
Bought by
Fernandez Fernando A and Martinez Danilo R
Home Financials for this Owner
Home Financials are based on the most recent Mortgage that was taken out on this home.
Original Mortgage
$238,789
Interest Rate
4.87%
Mortgage Type
FHA
Create a Home Valuation Report for This Property
The Home Valuation Report is an in-depth analysis detailing your home's value as well as a comparison with similar homes in the area
Home Values in the Area
Average Home Value in this Area
Purchase History
| Date | Buyer | Sale Price | Title Company |
|---|---|---|---|
| Chalas Altagracia | -- | None Available | |
| Chalas Altragracia | $255,200 | None Available | |
| 2017 1 Reo Llc | $255,065 | None Available | |
| Fernandez Fernando A | $245,000 | -- |
Source: Public Records
Mortgage History
| Date | Status | Borrower | Loan Amount |
|---|---|---|---|
| Previous Owner | Chalas Altragracia | $255,982 | |
| Previous Owner | Fernandez Fernando A | $238,789 |
Source: Public Records
Tax History Compared to Growth
Tax History
| Year | Tax Paid | Tax Assessment Tax Assessment Total Assessment is a certain percentage of the fair market value that is determined by local assessors to be the total taxable value of land and additions on the property. | Land | Improvement |
|---|---|---|---|---|
| 2025 | $8,738 | $171,500 | $66,400 | $105,100 |
| 2024 | $8,409 | $171,500 | $66,400 | $105,100 |
| 2022 | $7,961 | $171,500 | $66,400 | $105,100 |
| 2021 | $7,676 | $171,500 | $66,400 | $105,100 |
| 2020 | $7,160 | $171,500 | $66,400 | $105,100 |
| 2019 | $6,929 | $167,600 | $65,000 | $102,600 |
| 2018 | $7,454 | $172,300 | $64,400 | $107,900 |
| 2017 | $7,118 | $171,100 | $64,000 | $107,100 |
| 2016 | $7,515 | $173,200 | $60,000 | $113,200 |
| 2015 | $7,115 | $173,200 | $60,000 | $113,200 |
| 2014 | $7,549 | $260,300 | $138,800 | $121,500 |
Source: Public Records
Map
Nearby Homes
- 366-2-382 Trenton Ave Unit 5D
- 366-2-382 Trenton Ave Unit 5B
- 366 Trenton Ave Unit 4F
- 41 Columbia Ave
- 432-434 Trenton Ave Unit 7
- 432 Trenton Ave
- 238 Vernon Ave Unit 240
- 165 E 2nd St
- 92 Wabash Ave
- 30 E 2nd St
- 126 Gould Ave
- 156 Kentucky Ave Unit 158
- 237 E 6th St
- 275 E 7th St
- 291 Maryland Ave Unit 295
- 21 E 5th St
- 45 Dey St
- 170 W 4th St
- 693 E 31st St Unit 695
- 693-695 E 31st St
- 315 Wabash Ave Unit 317
- 63-65 Dundee Ave Unit 2
- 63 Dundee Ave Unit 65
- 63 Dundee Ave Unit 2
- 67 Dundee Ave Unit 69
- 71 Dundee Ave Unit 73
- 104 Potomac Ave Unit 106
- 282 Buffalo Ave Unit 284
- 286 Buffalo Ave Unit 288
- 290 Buffalo Ave
- 75 Dundee Ave Unit 77
- 100 Potomac Ave Unit 102
- 294 Buffalo Ave Unit 296
- 68 Dundee Ave Unit 70
- 64 Dundee Ave Unit 66
- 343 Wabash Ave
- 72 Dundee Ave Unit 74
- 83 Dundee Ave
- 76 Dundee Ave Unit 78
- 338 Wabash Ave Unit 340