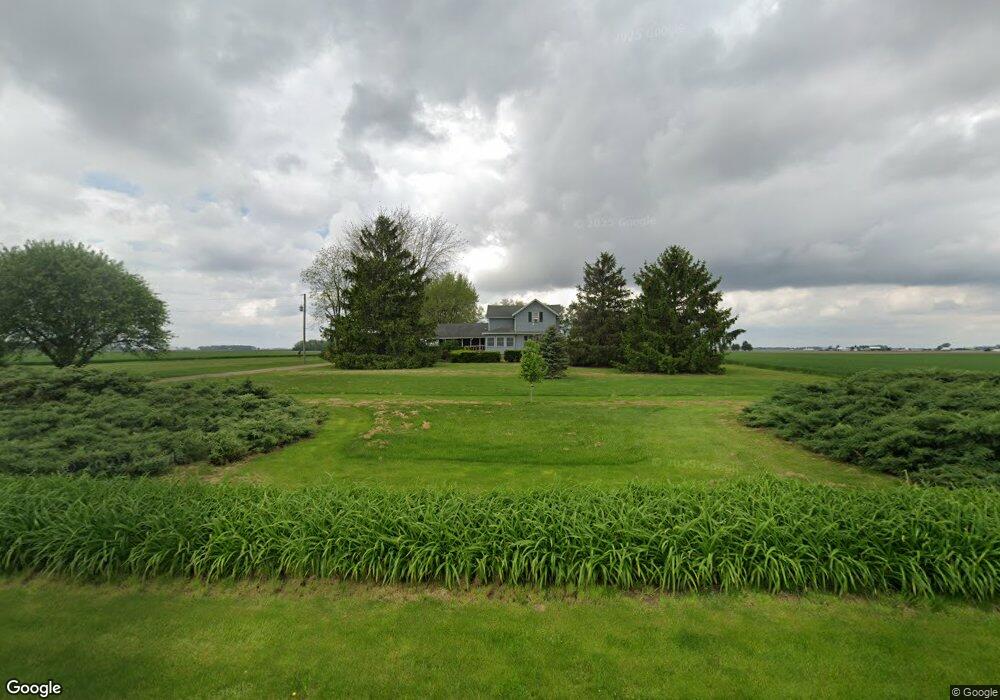
3191 Kill Rd Delphos, OH 45833
Estimated Value: $135,000 - $207,000
3
Beds
2
Baths
1,696
Sq Ft
$101/Sq Ft
Est. Value
About This Home
This home is located at 3191 Kill Rd, Delphos, OH 45833 and is currently estimated at $171,355, approximately $101 per square foot. 3191 Kill Rd is a home located in Allen County.
Ownership History
Date
Name
Owned For
Owner Type
Purchase Details
Closed on
Jun 11, 2024
Sold by
Wienken Theodore J
Bought by
Kaylor Jarron
Current Estimated Value
Home Financials for this Owner
Home Financials are based on the most recent Mortgage that was taken out on this home.
Original Mortgage
$80,000
Outstanding Balance
$78,810
Interest Rate
7.22%
Mortgage Type
Seller Take Back
Estimated Equity
$92,545
Purchase Details
Closed on
Apr 9, 2015
Sold by
Wienken Theodore J and Wienken Sandra S
Bought by
Wienken Theodore J and Wienken Sandra S
Purchase Details
Closed on
Aug 1, 1983
Bought by
Wienken Theodore J
Create a Home Valuation Report for This Property
The Home Valuation Report is an in-depth analysis detailing your home's value as well as a comparison with similar homes in the area
Purchase History
| Date | Buyer | Sale Price | Title Company |
|---|---|---|---|
| Kaylor Jarron | $90,000 | None Listed On Document | |
| Wienken Theodore J | -- | None Available | |
| Wienken Theodore J | $42,000 | -- |
Source: Public Records
Mortgage History
| Date | Status | Borrower | Loan Amount |
|---|---|---|---|
| Open | Kaylor Jarron | $80,000 |
Source: Public Records
Tax History
| Year | Tax Paid | Tax Assessment Tax Assessment Total Assessment is a certain percentage of the fair market value that is determined by local assessors to be the total taxable value of land and additions on the property. | Land | Improvement |
|---|---|---|---|---|
| 2024 | $1,707 | $56,070 | $15,120 | $40,950 |
| 2023 | $1,266 | $38,680 | $10,430 | $28,250 |
| 2022 | $1,293 | $38,680 | $10,430 | $28,250 |
| 2021 | $1,331 | $38,680 | $10,430 | $28,250 |
| 2020 | $1,086 | $34,380 | $10,190 | $24,190 |
| 2019 | $1,086 | $34,380 | $10,190 | $24,190 |
| 2018 | $1,139 | $34,380 | $10,190 | $24,190 |
| 2017 | $1,006 | $30,980 | $10,190 | $20,790 |
| 2016 | $1,004 | $30,980 | $10,190 | $20,790 |
| 2015 | $1,048 | $30,980 | $10,190 | $20,790 |
| 2014 | $1,048 | $32,070 | $10,190 | $21,880 |
| 2013 | $1,061 | $32,070 | $10,190 | $21,880 |
Source: Public Records
Map
Nearby Homes
- 21302 Masters Rd
- 14101 Allentown Rd
- 19059 Wittington St
- 15044 Main St
- 18906 Bebb St
- 19195 State Rd
- 241 King St
- 827 S Washington St
- 420 S Cass St
- 424 S Canal St
- 310 E Suthoff St
- 483 S Franklin St
- 708 W 1st St
- 221 S Main St
- 709 W 4th St
- 409 N Bredeick St
- 714 Briggs Ave Unit 1
- 537 / 539 Toomey
- 408 N Mulberry St
- 433 W 4th St
Your Personal Tour Guide
Ask me questions while you tour the home.