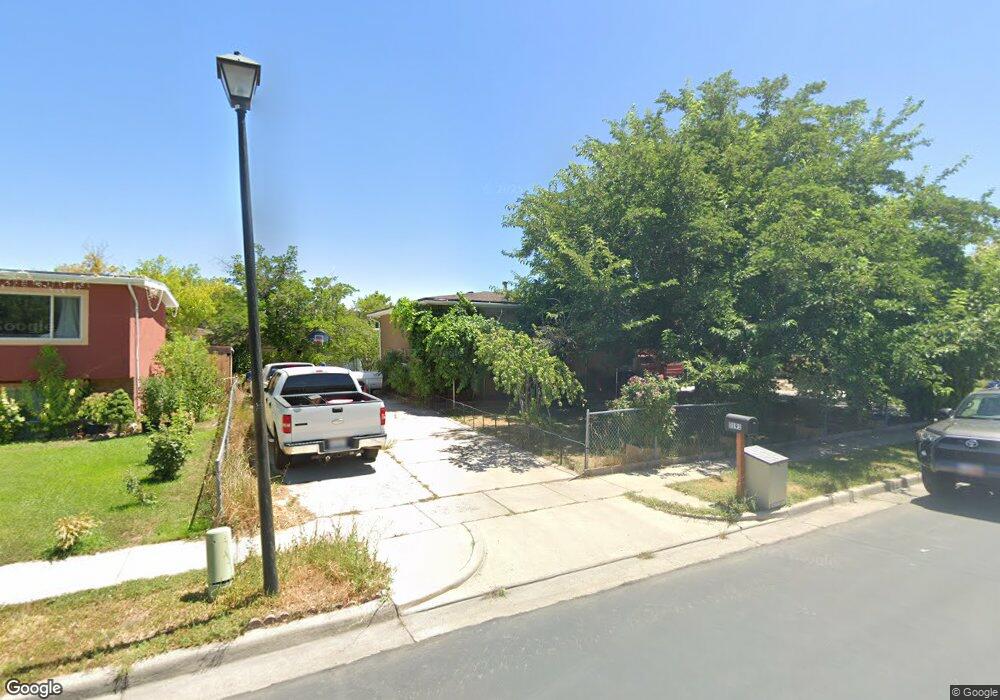
3191 S 4100 W Salt Lake City, UT 84120
Granger NeighborhoodEstimated Value: $411,000 - $450,000
5
Beds
2
Baths
1,888
Sq Ft
$228/Sq Ft
Est. Value
About This Home
This home is located at 3191 S 4100 W, Salt Lake City, UT 84120 and is currently estimated at $429,895, approximately $227 per square foot. 3191 S 4100 W is a home located in Salt Lake County with nearby schools including Monroe Elementary School, West Lake Junior High School, and Granger High School.
Ownership History
Date
Name
Owned For
Owner Type
Purchase Details
Closed on
Sep 4, 2020
Sold by
T & S Ventures Llc
Bought by
Teeples Tyler
Current Estimated Value
Purchase Details
Closed on
Mar 27, 2020
Sold by
Vanhuynh Quy Van
Bought by
T & S Ventures Llc
Purchase Details
Closed on
Dec 20, 2012
Sold by
Manriquez Eleazar and Manriquez Salvdor
Bought by
Vanvanhuynh Quy Van
Home Financials for this Owner
Home Financials are based on the most recent Mortgage that was taken out on this home.
Original Mortgage
$124,699
Interest Rate
3.37%
Mortgage Type
FHA
Purchase Details
Closed on
Sep 27, 2001
Sold by
Gomez David and Gomez Mary Lou
Bought by
Manriquez Eleazar and Manriquez Salvador
Home Financials for this Owner
Home Financials are based on the most recent Mortgage that was taken out on this home.
Original Mortgage
$122,902
Interest Rate
6.91%
Mortgage Type
FHA
Create a Home Valuation Report for This Property
The Home Valuation Report is an in-depth analysis detailing your home's value as well as a comparison with similar homes in the area
Home Values in the Area
Average Home Value in this Area
Purchase History
| Date | Buyer | Sale Price | Title Company |
|---|---|---|---|
| Teeples Tyler | -- | Stewart Title Ins Agcy Of Ut | |
| T & S Ventures Llc | -- | Bay National Title Company | |
| Vanvanhuynh Quy Van | -- | Title West | |
| Manriquez Eleazar | -- | Guardian Title |
Source: Public Records
Mortgage History
| Date | Status | Borrower | Loan Amount |
|---|---|---|---|
| Previous Owner | Vanvanhuynh Quy Van | $124,699 | |
| Previous Owner | Manriquez Eleazar | $122,902 |
Source: Public Records
Tax History Compared to Growth
Tax History
| Year | Tax Paid | Tax Assessment Tax Assessment Total Assessment is a certain percentage of the fair market value that is determined by local assessors to be the total taxable value of land and additions on the property. | Land | Improvement |
|---|---|---|---|---|
| 2025 | $2,428 | $382,500 | $135,700 | $246,800 |
| 2024 | $2,428 | $371,900 | $131,800 | $240,100 |
| 2023 | $2,435 | $357,100 | $126,800 | $230,300 |
| 2022 | $2,357 | $346,700 | $124,300 | $222,400 |
| 2021 | $2,150 | $284,200 | $95,600 | $188,600 |
| 2020 | $1,925 | $240,100 | $89,900 | $150,200 |
| 2019 | $1,766 | $212,500 | $89,900 | $122,600 |
| 2018 | $1,703 | $197,500 | $56,200 | $141,300 |
| 2017 | $1,450 | $171,100 | $56,200 | $114,900 |
| 2016 | $1,325 | $156,500 | $56,200 | $100,300 |
| 2015 | $1,260 | $141,700 | $63,700 | $78,000 |
| 2014 | $1,232 | $135,800 | $61,700 | $74,100 |
Source: Public Records
Map
Nearby Homes
- 3185 S 4060 W
- 4234 W 3175 S Unit 58 A
- 3260 Eastcrest Rd Unit 269
- 4242 W 3225 S
- 3264 Westcrest Rd Unit 42
- 4230 W 3375 S Unit 240
- 3333 S Westcrest Rd Unit 249
- 4230 W 3425 S Unit 226
- 3414 Westcrest Rd Unit 15
- 3991 W 2920 S
- 4217 W 3450 S Unit 218
- 4232 W 3475 S Unit 211
- 3907 W Rockwood Way Unit B
- 4353 W 3335 S
- 3871 W 2925 S
- 3486 S Westcrest Rd Unit 2
- 4357 W Cortney Dr
- 3214 S 4500 W
- 4050 W Mann Way
- 3511 S Lydia Ann Ln