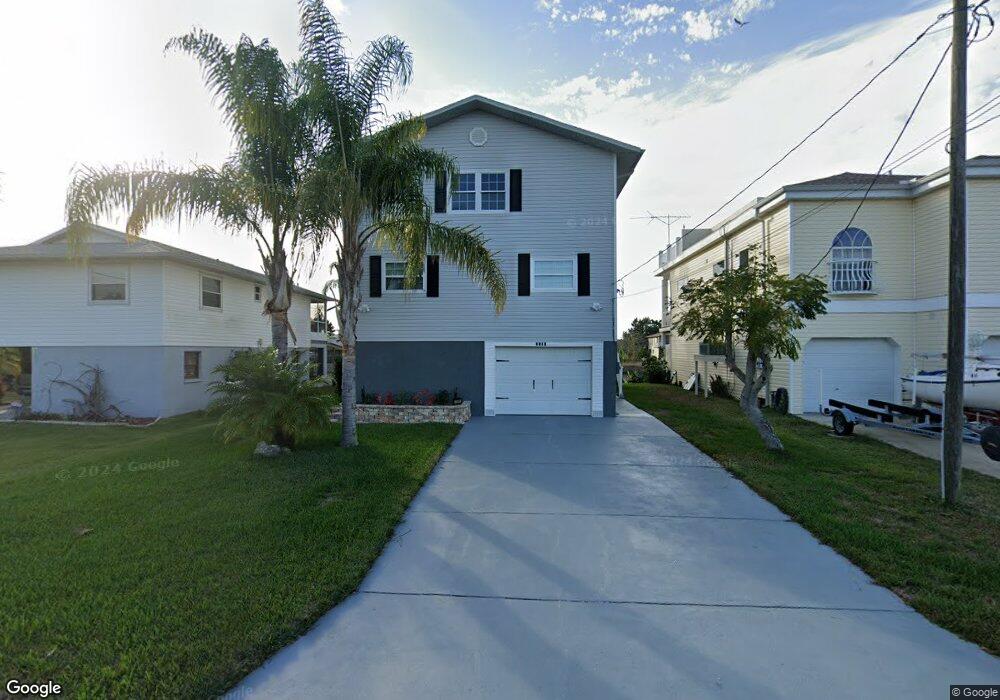
3191 Sea Grape Dr Hernando Beach, FL 34607
3
Beds
3
Baths
1,848
Sq Ft
4,792
Sq Ft Lot
About This Home
This home is located at 3191 Sea Grape Dr, Hernando Beach, FL 34607. 3191 Sea Grape Dr is a home located in Hernando County with nearby schools including Westside Elementary School, Fox Chapel Middle School, and Weeki Wachee High School.
Create a Home Valuation Report for This Property
The Home Valuation Report is an in-depth analysis detailing your home's value as well as a comparison with similar homes in the area
Home Values in the Area
Average Home Value in this Area
Tax History
| Year | Tax Paid | Tax Assessment Tax Assessment Total Assessment is a certain percentage of the fair market value that is determined by local assessors to be the total taxable value of land and additions on the property. | Land | Improvement |
|---|---|---|---|---|
| 2024 | $7,323 | $481,765 | $57,200 | $424,565 |
| 2023 | $7,323 | $478,486 | $53,300 | $425,186 |
| 2022 | $7,323 | $441,967 | $43,250 | $398,717 |
| 2021 | $3,920 | $261,207 | $23,400 | $237,807 |
| 2020 | $3,827 | $232,588 | $22,100 | $210,488 |
| 2019 | $3,469 | $186,418 | $21,300 | $165,118 |
| 2018 | $2,670 | $182,465 | $19,650 | $162,815 |
| 2017 | $2,796 | $152,333 | $15,000 | $137,333 |
| 2016 | $3,184 | $177,395 | $0 | $0 |
| 2015 | $3,061 | $161,268 | $0 | $0 |
| 2014 | $2,352 | $146,607 | $0 | $0 |
Source: Public Records
Map
Nearby Homes
- 3178 Sea Grape Dr
- 3227 Rose Arbor Dr
- 3221 Rose Arbor Dr
- 3209 Rose Arbor Dr
- 0 Sea Grape Dr Unit Lots 19 and 20
- 0 Sea Grape Dr Unit Lot 10 MFRTB8387837
- 0 Fernleaf Dr Unit 2253584
- 3185 Rose Arbor Dr
- 3244 Rose Arbor Dr
- 3276 Sea Grape Dr
- 3243 Azalea Dr
- 0 Shoal Line Blvd Unit 2253508
- 4034 Amberjack Dr
- 4066 Amberjack Dr
- 3496 Amberjack Dr
- 3312 Holly Springs Dr
- 3314 Fernleaf Dr
- 3332 Poinsettia Dr
- 3270 Hibiscus Dr
- 3223 Hibiscus Dr
- 3185 Sea Grape Dr
- 3197 Sea Grape Dr
- 3179 Sea Grape Dr
- 3203 Sea Grape Dr
- 3179 3179 Sea Grape Dr
- 3173 Sea Grape Dr
- 3192 Sea Grape Dr
- 3198 Sea Grape Dr
- 3240 Sea Grape Dr
- Lot 41 Sea Grape Dr
- 3420 Sea Grape Dr
- #28 Sea Grape Dr
- LOT11 Sea Grape Dr
- LOT24 Sea Grape Dr
- 3281 Sea Grape Dr
- 0000 Sea Grape Dr
- 3186 Sea Grape Dr
- 3180 Sea Grape Dr
- 3204 Sea Grape Dr
- 3215 Sea Grape Dr
Your Personal Tour Guide
Ask me questions while you tour the home.