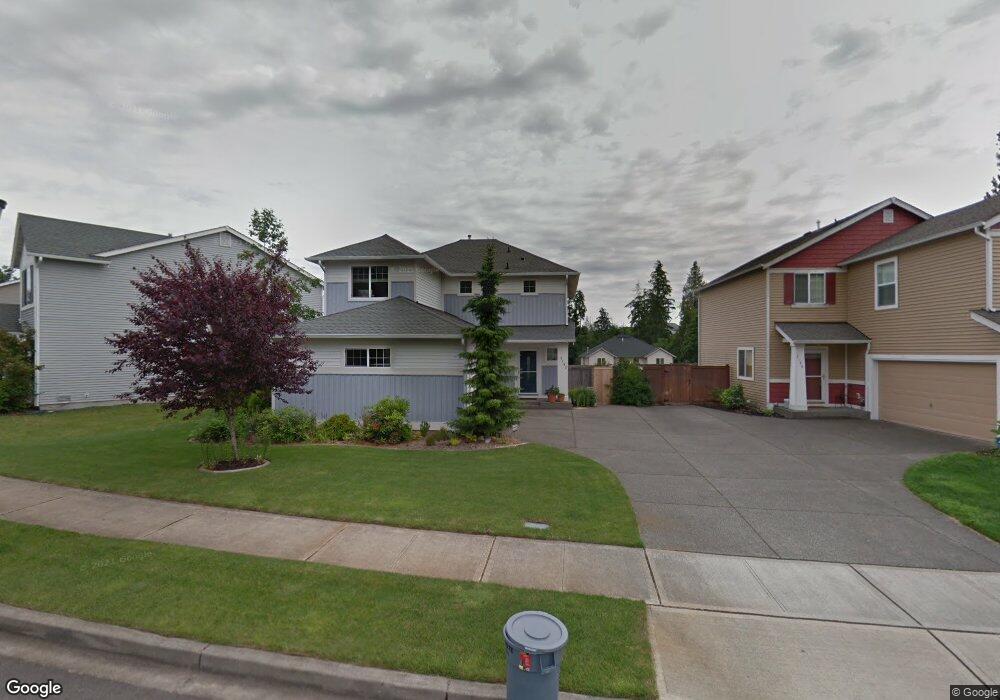
3192 Brown Loop Dupont, WA 98327
Estimated Value: $516,523 - $542,000
3
Beds
3
Baths
1,608
Sq Ft
$330/Sq Ft
Est. Value
About This Home
This home is located at 3192 Brown Loop, Dupont, WA 98327 and is currently estimated at $530,381, approximately $329 per square foot. 3192 Brown Loop is a home located in Pierce County with nearby schools including Chloe Clark Elementary School, Saltars Point Elementary School, and Pioneer Middle School.
Ownership History
Date
Name
Owned For
Owner Type
Purchase Details
Closed on
Jan 3, 2012
Sold by
Thoren Kendra L
Bought by
Marlett Dustin E and Thoren Kendra L
Current Estimated Value
Home Financials for this Owner
Home Financials are based on the most recent Mortgage that was taken out on this home.
Original Mortgage
$227,776
Outstanding Balance
$155,633
Interest Rate
3.91%
Mortgage Type
VA
Estimated Equity
$374,748
Purchase Details
Closed on
Apr 8, 2008
Sold by
Bergman David H and Bergman Aspen M
Bought by
Thoren Kendra L
Home Financials for this Owner
Home Financials are based on the most recent Mortgage that was taken out on this home.
Original Mortgage
$265,000
Interest Rate
6.22%
Mortgage Type
Purchase Money Mortgage
Purchase Details
Closed on
Mar 24, 2005
Sold by
The Quadrant Corp
Bought by
Bergmann David H and Bergmann Aspen M
Home Financials for this Owner
Home Financials are based on the most recent Mortgage that was taken out on this home.
Original Mortgage
$175,227
Interest Rate
5%
Mortgage Type
Purchase Money Mortgage
Create a Home Valuation Report for This Property
The Home Valuation Report is an in-depth analysis detailing your home's value as well as a comparison with similar homes in the area
Home Values in the Area
Average Home Value in this Area
Purchase History
| Date | Buyer | Sale Price | Title Company |
|---|---|---|---|
| Marlett Dustin E | -- | Fidelity National Title | |
| Thoren Kendra L | $265,000 | First American Title Ins Co | |
| Bergmann David H | $219,034 | Chicago Title |
Source: Public Records
Mortgage History
| Date | Status | Borrower | Loan Amount |
|---|---|---|---|
| Open | Marlett Dustin E | $227,776 | |
| Closed | Thoren Kendra L | $265,000 | |
| Previous Owner | Bergmann David H | $175,227 | |
| Closed | Bergmann David H | $32,855 |
Source: Public Records
Tax History Compared to Growth
Tax History
| Year | Tax Paid | Tax Assessment Tax Assessment Total Assessment is a certain percentage of the fair market value that is determined by local assessors to be the total taxable value of land and additions on the property. | Land | Improvement |
|---|---|---|---|---|
| 2025 | $3,470 | $472,600 | $225,700 | $246,900 |
| 2024 | $3,470 | $451,000 | $217,400 | $233,600 |
| 2023 | $3,470 | $431,000 | $208,300 | $222,700 |
| 2022 | $3,427 | $438,100 | $208,300 | $229,800 |
| 2021 | $3,229 | $320,500 | $132,300 | $188,200 |
| 2019 | $2,854 | $289,400 | $110,300 | $179,100 |
| 2018 | $3,096 | $279,000 | $110,300 | $168,700 |
| 2017 | $2,771 | $265,100 | $95,400 | $169,700 |
| 2016 | $2,642 | $236,900 | $80,500 | $156,400 |
| 2014 | $2,562 | $234,600 | $80,500 | $154,100 |
| 2013 | $2,562 | $217,000 | $82,100 | $134,900 |
Source: Public Records
Map
Nearby Homes
- 3178 Hoffman Hill Blvd
- 3172 Sheaser Way
- 3114 Walker Rd
- 3073 Hoffman Hill Blvd
- 1375 Foreman Rd
- 1305 Foreman Rd
- 1335 Foreman Rd
- 1162 Swan Loop
- 3572 Hoffman Hill Blvd
- 1061 Hiton Cir
- 2420 Simmons St Unit B
- 2055 Garry Oaks Ave Unit B
- 1975 Garry Oaks Ave Unit C
- 1856 Spencer Ct Unit 12F
- 2176 McDonald Ave
- 1607 Kincaid St Unit E-8
- 1680 Kennedy Place Unit A4
- 2237 Tolmie St
- 2176 Palisade Blvd Unit F-3
- 2147 Hammond Ave Unit B10
- 3196 Brown Loop
- 3182 Brown Loop
- 1811 Ridge View Ct
- 1809 Ridge View Ct
- 3185 Brown Loop
- 3189 Brown Loop
- 1813 Ridge View Ct
- 3180 Brown Loop
- 3183 Brown Loop
- 1798 Brown Ave
- 3178 Brown Loop
- 3181 Brown Loop
- 1815 Ridge View Ct
- 3179 Brown Loop
- 3174 Brown Loop
- 1786 Brown Ave
- 3183 Walker Rd
- 1819 Ridge View Ct
- 3177 Brown Loop
- 1772 Brown Ave