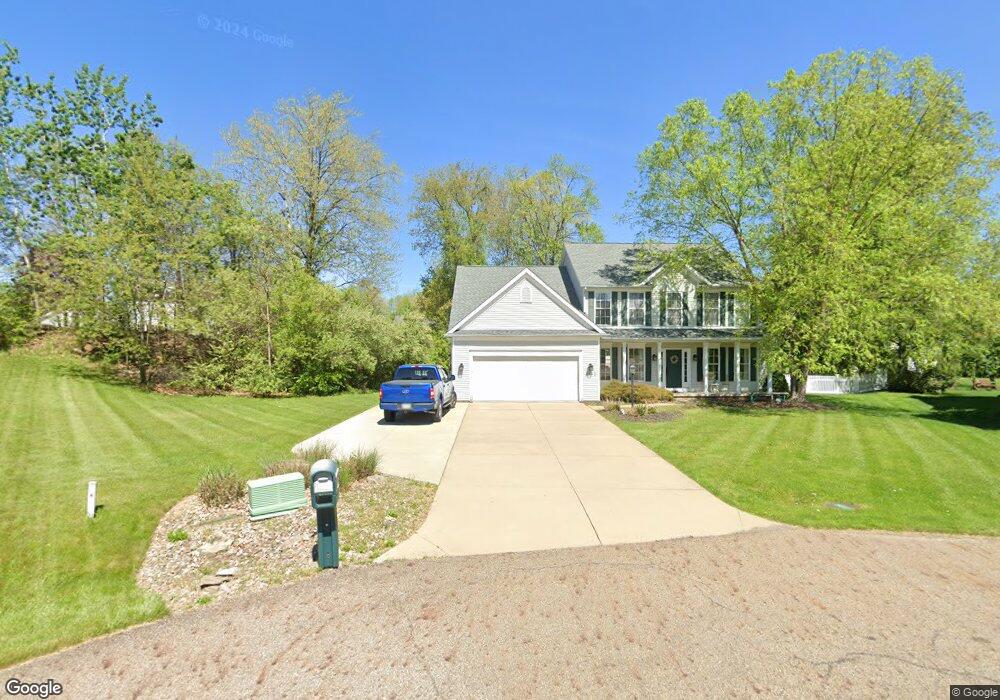
3192 Deborah Ct Uniontown, OH 44685
Estimated Value: $372,000 - $477,000
4
Beds
3
Baths
2,894
Sq Ft
$149/Sq Ft
Est. Value
About This Home
This home is located at 3192 Deborah Ct, Uniontown, OH 44685 and is currently estimated at $432,328, approximately $149 per square foot. 3192 Deborah Ct is a home located in Summit County with nearby schools including Greenwood Elementary School, Green Primary School, and Green Intermediate Elementary School.
Ownership History
Date
Name
Owned For
Owner Type
Purchase Details
Closed on
Jul 26, 2007
Sold by
Buck Brian L and Buck Laura A
Bought by
Aull Joseph L and Aull Kristin J
Current Estimated Value
Home Financials for this Owner
Home Financials are based on the most recent Mortgage that was taken out on this home.
Original Mortgage
$198,000
Outstanding Balance
$126,003
Interest Rate
6.76%
Mortgage Type
Purchase Money Mortgage
Estimated Equity
$306,325
Purchase Details
Closed on
Apr 2, 2004
Sold by
James Builders Inc
Bought by
Buck Brian L and Buck Laura A
Home Financials for this Owner
Home Financials are based on the most recent Mortgage that was taken out on this home.
Original Mortgage
$224,700
Interest Rate
5.65%
Mortgage Type
Purchase Money Mortgage
Purchase Details
Closed on
Sep 12, 2003
Sold by
Union Commerce Corp
Bought by
James Builders Inc
Home Financials for this Owner
Home Financials are based on the most recent Mortgage that was taken out on this home.
Original Mortgage
$800,000
Interest Rate
6.04%
Mortgage Type
Purchase Money Mortgage
Create a Home Valuation Report for This Property
The Home Valuation Report is an in-depth analysis detailing your home's value as well as a comparison with similar homes in the area
Home Values in the Area
Average Home Value in this Area
Purchase History
| Date | Buyer | Sale Price | Title Company |
|---|---|---|---|
| Aull Joseph L | $247,200 | Attorney | |
| Buck Brian L | $236,597 | -- | |
| James Builders Inc | $47,500 | Land America/Lawyers Title |
Source: Public Records
Mortgage History
| Date | Status | Borrower | Loan Amount |
|---|---|---|---|
| Open | Aull Joseph L | $198,000 | |
| Closed | Buck Brian L | $224,700 | |
| Previous Owner | James Builders Inc | $800,000 |
Source: Public Records
Tax History Compared to Growth
Tax History
| Year | Tax Paid | Tax Assessment Tax Assessment Total Assessment is a certain percentage of the fair market value that is determined by local assessors to be the total taxable value of land and additions on the property. | Land | Improvement |
|---|---|---|---|---|
| 2025 | $5,857 | $123,827 | $21,616 | $102,211 |
| 2024 | $5,857 | $123,827 | $21,616 | $102,211 |
| 2023 | $5,857 | $123,827 | $21,616 | $102,211 |
| 2022 | $5,265 | $99,943 | $17,434 | $82,509 |
| 2021 | $4,938 | $99,943 | $17,434 | $82,509 |
| 2020 | $4,843 | $99,940 | $17,430 | $82,510 |
| 2019 | $4,450 | $85,950 | $14,780 | $71,170 |
| 2018 | $4,548 | $85,950 | $14,780 | $71,170 |
| 2017 | $4,204 | $85,950 | $14,780 | $71,170 |
| 2016 | $4,183 | $74,510 | $14,780 | $59,730 |
| 2015 | $4,204 | $74,510 | $14,780 | $59,730 |
| 2014 | $4,177 | $74,510 | $14,780 | $59,730 |
| 2013 | $4,277 | $75,890 | $14,780 | $61,110 |
Source: Public Records
Map
Nearby Homes
- 3212 Deborah Ct
- 3217 Deborah Ct
- 2500 Marlborough Dr
- Northwood Plan at Spring Hill - Spring Hill Villas
- Kenai Plan at Spring Hill - Spring Hill Villas
- Bradbern Plan at Spring Hill - Spring Hill Villas
- Sarasota Plan at Spring Hill - Spring Hill Villas
- Holston Plan at Spring Hill - Spring Hill Villas
- Chester Plan at Spring Hill - Spring Hill Villas
- 2418 Island Dr
- 3534 Chanticleer Ct
- 3514 Chanticleer Ct
- 2511 Royal County Down
- 2535 Royal County Down Unit B
- 2518 Glenshire Cir Unit 36A
- 3541 Elmhurst Cir
- 2538 Royal County Down
- 3979 Northdale St NW
- 3598 Elmhurst Cir
- 2944 Sunset Dr
- 90 Deborah
- 3173 Turtle Bay Cir
- 3193 Deborah Ct
- 3155 Turtle Bay Cir
- 3187 Turtle Bay Cir
- 3200 Deborah Ct
- 3201 Deborah Ct
- 3147 Turtle Bay Cir
- 3197 Turtle Bay Cir
- 0 Turtle Bay Cir Unit 63 3264969
- 0 Turtle Bay Cir Unit 62 3264955
- 0 Turtle Bay Cir Unit 3249481
- 3209 Deborah Ct
- 3137 Turtle Bay Cir
- 3205 Turtle Bay Cir
- 3648 Myersville Rd
- 3658 Myersville Rd
- 3636 Myersville Rd
- 0 Deborah Ct Unit 87 3264940
- 0 Deborah Ct Unit 3629166