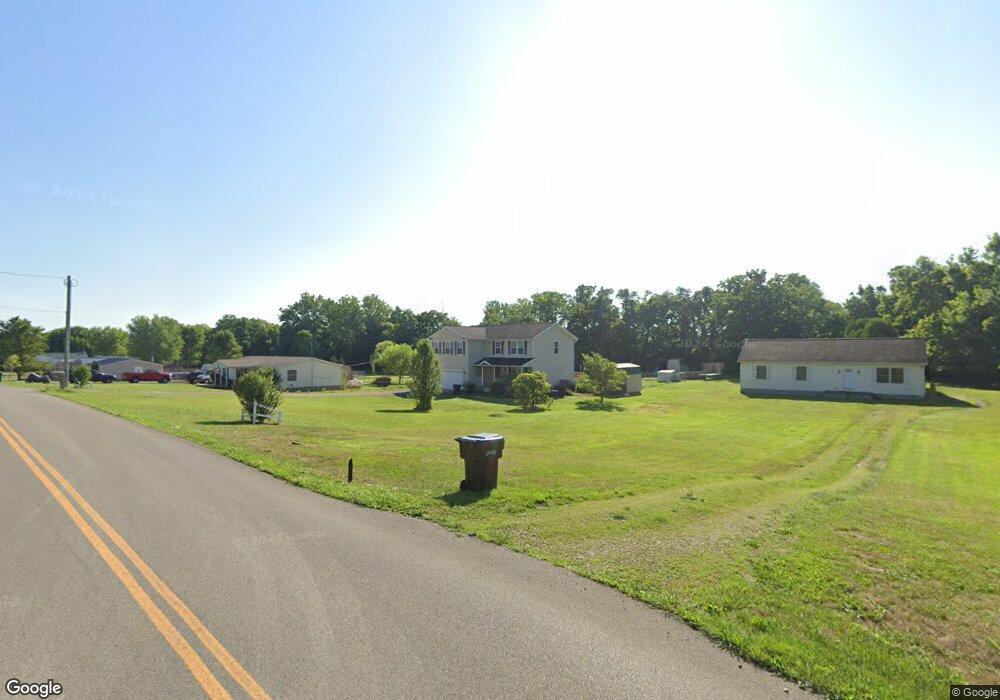
3194 Cattail Rd Chillicothe, OH 45601
Estimated Value: $317,000 - $359,000
4
Beds
3
Baths
2,180
Sq Ft
$156/Sq Ft
Est. Value
About This Home
This home is located at 3194 Cattail Rd, Chillicothe, OH 45601 and is currently estimated at $340,033, approximately $155 per square foot. 3194 Cattail Rd is a home located in Ross County with nearby schools including Unioto Elementary School, Unioto Middle School, and Unioto High School.
Ownership History
Date
Name
Owned For
Owner Type
Purchase Details
Closed on
Aug 30, 2011
Sold by
Hoover Kristan F and Cutler Kristan
Bought by
Hoover Brent N
Current Estimated Value
Home Financials for this Owner
Home Financials are based on the most recent Mortgage that was taken out on this home.
Original Mortgage
$120,000
Outstanding Balance
$75,598
Interest Rate
4.58%
Mortgage Type
New Conventional
Estimated Equity
$264,435
Purchase Details
Closed on
Jun 19, 2008
Sold by
Hoover Brent N and Hoover Kristan
Bought by
Hoover Brent N and Hoover Kristan
Home Financials for this Owner
Home Financials are based on the most recent Mortgage that was taken out on this home.
Original Mortgage
$144,000
Interest Rate
6.05%
Mortgage Type
Construction
Purchase Details
Closed on
Oct 10, 2005
Sold by
Countrytyme Grover City Ltd
Bought by
Hoover Brent N
Purchase Details
Closed on
Jan 31, 2005
Sold by
Ater Robert F
Bought by
Countrywide Grove City Ltd
Create a Home Valuation Report for This Property
The Home Valuation Report is an in-depth analysis detailing your home's value as well as a comparison with similar homes in the area
Home Values in the Area
Average Home Value in this Area
Purchase History
| Date | Buyer | Sale Price | Title Company |
|---|---|---|---|
| Hoover Brent N | -- | Title First Agency Inc | |
| Hoover Brent N | -- | Lawyers Title | |
| Hoover Brent N | $16,500 | None Available | |
| Countrywide Grove City Ltd | $30,000 | The Title Company Ltd |
Source: Public Records
Mortgage History
| Date | Status | Borrower | Loan Amount |
|---|---|---|---|
| Open | Hoover Brent N | $120,000 | |
| Closed | Hoover Brent N | $144,000 |
Source: Public Records
Tax History Compared to Growth
Tax History
| Year | Tax Paid | Tax Assessment Tax Assessment Total Assessment is a certain percentage of the fair market value that is determined by local assessors to be the total taxable value of land and additions on the property. | Land | Improvement |
|---|---|---|---|---|
| 2024 | $3,038 | $88,080 | $5,870 | $82,210 |
| 2023 | $3,038 | $88,080 | $5,870 | $82,210 |
| 2022 | $3,104 | $88,080 | $5,870 | $82,210 |
| 2021 | $2,567 | $68,150 | $4,550 | $63,600 |
| 2020 | $2,581 | $68,150 | $4,550 | $63,600 |
| 2019 | $2,581 | $68,150 | $4,550 | $63,600 |
| 2018 | $2,480 | $64,180 | $4,220 | $59,960 |
| 2017 | $2,484 | $64,180 | $4,220 | $59,960 |
| 2016 | $2,420 | $64,180 | $4,220 | $59,960 |
| 2015 | $2,256 | $59,290 | $4,220 | $55,070 |
| 2014 | $2,778 | $74,820 | $4,220 | $70,600 |
| 2013 | $2,791 | $74,820 | $4,220 | $70,600 |
Source: Public Records
Map
Nearby Homes
- 69 Cook Ln
- 1667 Stone Rd Unit Lot 59
- 500 Old Elm Rd
- 11303 County Road 550
- 25 Woodland Way
- 265 Brookside Dr
- 14839 Westfall Road Lot 8
- 14839 Westfall Road Lot 2
- 14839 Westfall Road Lot 20
- 14839 Westfall Road Lot 4
- 2153 Egypt Pike
- 12690 Pleasant Valley Rd
- 186 Caitlin Dr
- 9942 Egypt Pike
- 435 Mount Carmel Rd
- 45 Custer Dr
- 13223 Pleasant Valley Rd
- 2391 Simmons Rd
- 559 Golfview Dr
- 0 US Rt 23 Unit 1857559
- 3188 Cattail Rd
- 3200 Cattail Rd
- 3220 Cattail Rd
- 3145 Cattail Rd
- 3244 Cattail Rd
- 3211 Cattail Rd
- 3092 Cattail Rd
- 3132 Cattail Rd
- 3219 Cattail Rd
- 3101 Cattail Rd
- 3091 Cattail Rd
- 3302 Cattail Rd
- 3250 Cattail Rd
- 3090 Cattail Rd
- 3314 Cattail Rd
- 3257 Cattail Rd
- 3257 Cattail Rd
- 3085 Cattail Rd
- 3319 Cattail Rd
- 3161 Cattail Rd