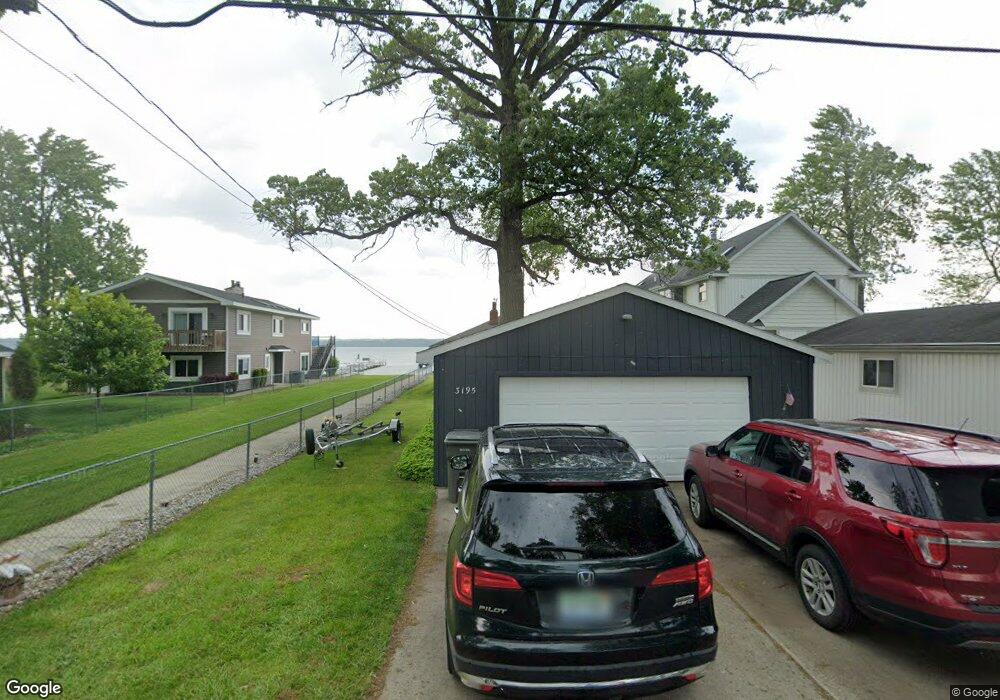
3195 Sandy Beach St Wayland, MI 49348
Estimated Value: $451,072 - $652,000
3
Beds
1
Bath
1,036
Sq Ft
$529/Sq Ft
Est. Value
About This Home
This home is located at 3195 Sandy Beach St, Wayland, MI 49348 and is currently estimated at $547,768, approximately $528 per square foot. 3195 Sandy Beach St is a home located in Barry County with nearby schools including Wayland High School.
Ownership History
Date
Name
Owned For
Owner Type
Purchase Details
Closed on
Nov 8, 2017
Sold by
Dinkel Christopher J and Dinkel Kim A
Bought by
Dewitt James and Dewitt Lynae
Current Estimated Value
Purchase Details
Closed on
Jan 11, 2008
Sold by
Root Damon and Root Christeen
Bought by
Dinkel Christopher J and Dinkel Kim A
Home Financials for this Owner
Home Financials are based on the most recent Mortgage that was taken out on this home.
Original Mortgage
$202,000
Interest Rate
6.13%
Mortgage Type
Purchase Money Mortgage
Purchase Details
Closed on
Mar 6, 2007
Sold by
Phillips Ronald W and Phillips Katrin
Bought by
Root Damon and Root Christeen
Home Financials for this Owner
Home Financials are based on the most recent Mortgage that was taken out on this home.
Original Mortgage
$37,200
Interest Rate
6.31%
Mortgage Type
Stand Alone Second
Purchase Details
Closed on
May 20, 2005
Sold by
Staley Michael and Staley Kerri
Bought by
Phillips Ronald W and Phillips Katrin
Home Financials for this Owner
Home Financials are based on the most recent Mortgage that was taken out on this home.
Original Mortgage
$155,000
Interest Rate
5%
Mortgage Type
Fannie Mae Freddie Mac
Create a Home Valuation Report for This Property
The Home Valuation Report is an in-depth analysis detailing your home's value as well as a comparison with similar homes in the area
Home Values in the Area
Average Home Value in this Area
Purchase History
| Date | Buyer | Sale Price | Title Company |
|---|---|---|---|
| Dewitt James | $277,500 | Lighthouse Title Inc | |
| Dinkel Christopher J | $252,500 | River Valley Title | |
| Root Damon | $248,625 | Devon Title Agency | |
| Phillips Ronald W | $225,000 | -- |
Source: Public Records
Mortgage History
| Date | Status | Borrower | Loan Amount |
|---|---|---|---|
| Previous Owner | Dinkel Christopher J | $202,000 | |
| Previous Owner | Root Damon | $37,200 | |
| Previous Owner | Root Damon | $198,900 | |
| Previous Owner | Phillips Ronald W | $155,000 |
Source: Public Records
Tax History Compared to Growth
Tax History
| Year | Tax Paid | Tax Assessment Tax Assessment Total Assessment is a certain percentage of the fair market value that is determined by local assessors to be the total taxable value of land and additions on the property. | Land | Improvement |
|---|---|---|---|---|
| 2025 | $7,271 | $232,000 | $0 | $0 |
| 2024 | $7,271 | $210,200 | $0 | $0 |
| 2023 | $6,731 | $155,800 | $0 | $0 |
| 2022 | $6,731 | $155,800 | $0 | $0 |
| 2021 | $6,731 | $145,200 | $0 | $0 |
| 2020 | $6,578 | $139,400 | $0 | $0 |
| 2019 | $6,578 | $135,900 | $0 | $0 |
| 2018 | $5,200 | $125,900 | $84,400 | $41,500 |
| 2017 | $5,200 | $125,900 | $0 | $0 |
| 2016 | -- | $119,400 | $0 | $0 |
| 2015 | -- | $112,600 | $0 | $0 |
| 2014 | -- | $112,600 | $0 | $0 |
Source: Public Records
Map
Nearby Homes
- 3140 Sandy Beach St
- 12940 Cleland Ave
- 35 Cannonball Ln
- 12712 Sunrise Ct
- 2724 Pasture Ln
- 1980 Parker Dr
- 1736 Parker Dr
- 11908 Erica Ln Unit Site 66
- 3298 Elmwood Beach Rd
- 11617 Winchester Dr
- 11633 Marsh Rd
- 12169 Pine Meadows Dr
- 2919 Beatrice Ave
- 12031 Sandstone Dr
- 2919 Beatrice Ave
- 4304 Trails End Rd
- 5289 Marsh Rd
- 11065 W M 179 Hwy
- 590 129th Ave
- 6432 Marsh Rd
- 3203 Sandy Beach St
- 3179 Sandy Beach St
- 3169 Sandy Beach St
- 3172 Sandy Beach St
- 3217 Sandy Beach St
- 3235 Sandy Beach St
- 3143 Sandy Beach St
- 3227 Sandy Beach St
- 12925 Cleland Ave
- 3241 Sandy Beach St
- 3137 Sandy Beach St
- 0 Sandy Beach St Unit Parce 3260912
- 0 Sandy Beach St Unit 3229415
- 0 Sandy Beach St Unit Vacan
- 3142 Sandy Beach St
- 12942 Sweetland Dr
- 3247 Sandy Beach St
- 12933 Cleland Ave
- 3255 Sandy Beach St
- 3240 Sandy Beach St