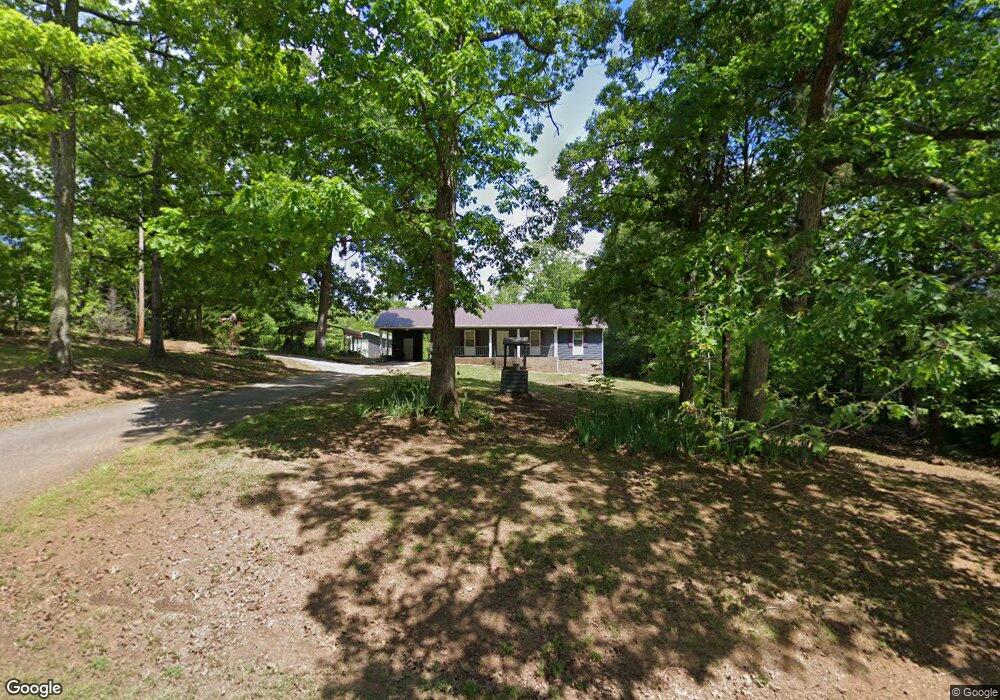
3196 Finch Farm Rd Trinity, NC 27370
Estimated Value: $205,247 - $248,000
Studio
2
Baths
1,248
Sq Ft
$185/Sq Ft
Est. Value
About This Home
This home is located at 3196 Finch Farm Rd, Trinity, NC 27370 and is currently estimated at $230,562, approximately $184 per square foot. 3196 Finch Farm Rd is a home located in Randolph County with nearby schools including Hopewell Elementary School, Wheatmore Middle School, and Wheatmore High School.
Ownership History
Date
Name
Owned For
Owner Type
Purchase Details
Closed on
Feb 3, 2025
Sold by
Lambeth Marty Lane and Lambeth Rebecca F
Bought by
Thompson Kimberly L and Thompson Kip L
Current Estimated Value
Home Financials for this Owner
Home Financials are based on the most recent Mortgage that was taken out on this home.
Original Mortgage
$128,000
Outstanding Balance
$124,455
Interest Rate
6.13%
Mortgage Type
New Conventional
Estimated Equity
$106,107
Purchase Details
Closed on
Jan 26, 2024
Sold by
Thompson Kimberly Lambeth and Lambeth Marty Lane
Bought by
Lambeth Thompson Kimberly and Lane Lambeth Marty
Purchase Details
Closed on
Jul 6, 2021
Sold by
Lambeth Merrill L
Bought by
Thompson Kimberly Lambeth and Lambeth Marty Lane
Purchase Details
Closed on
Sep 25, 1989
Bought by
Lambeth Merrill L Lambeth Katheri
Create a Home Valuation Report for This Property
The Home Valuation Report is an in-depth analysis detailing your home's value as well as a comparison with similar homes in the area
Home Values in the Area
Average Home Value in this Area
Purchase History
| Date | Buyer | Sale Price | Title Company |
|---|---|---|---|
| Thompson Kimberly L | -- | None Listed On Document | |
| Lambeth Thompson Kimberly | -- | None Listed On Document | |
| Thompson Kimberly Lambeth | -- | Law Office Of Ben C Morgan | |
| Lambeth Merrill L Lambeth Katheri | $10,000 | -- |
Source: Public Records
Mortgage History
| Date | Status | Borrower | Loan Amount |
|---|---|---|---|
| Open | Thompson Kimberly L | $128,000 |
Source: Public Records
Tax History
| Year | Tax Paid | Tax Assessment Tax Assessment Total Assessment is a certain percentage of the fair market value that is determined by local assessors to be the total taxable value of land and additions on the property. | Land | Improvement |
|---|---|---|---|---|
| 2025 | $1,126 | $160,270 | $42,500 | $117,770 |
| 2024 | $1,110 | $160,270 | $42,500 | $117,770 |
| 2023 | $1,110 | $160,270 | $42,500 | $117,770 |
| 2022 | $999 | $117,880 | $32,000 | $85,880 |
| 2021 | $999 | $117,880 | $32,000 | $85,880 |
| 2020 | $999 | $117,880 | $32,000 | $85,880 |
| 2019 | $999 | $117,880 | $32,000 | $85,880 |
| 2018 | $955 | $108,830 | $32,000 | $76,830 |
| 2016 | $929 | $108,833 | $32,000 | $76,833 |
| 2015 | $468 | $108,833 | $32,000 | $76,833 |
| 2014 | -- | $108,833 | $32,000 | $76,833 |
Source: Public Records
Map
Nearby Homes
- 3554 Finch Farm Rd
- 2825 Fuller Mill Rd N
- 1655 Jades Way
- 3523 Old Mountain Rd
- 2953 Little Creek Rd
- 5127 Sylvan Trail
- 2609 Tree Hollow Extension
- 5020 Crest Ct
- 4997 Payne St
- 0 Gate Dr
- 4229 Fuller Mill Rd N
- 3759 Fuller Mill Rd N
- 0000 Thayer Rd
- Lot 7 Thayer Rd
- Lot 12 Skeens Mill Rd
- Lot 10 Skeens Mill Rd
- 00 Evelyn Dr
- 1874 Thayer Rd
- 132 Friendly Rd
- 344 Blythe Dr
- 3212 Finch Farm Rd
- 3232 Finch Farm Rd
- 3225 Finch Farm Rd
- 3274 Finch Farm Rd
- 3284 Finch Farm Rd
- 3124 Finch Farm Rd
- 3148 Finch Farm Rd
- 3103 Finch Farm Rd
- 3291 Finch Farm Rd
- 3160 Finch Farm Rd
- 2387 Greenbrook Dr
- 3320 Finch Farm Rd
- 2385 Greenbrook Dr
- 3321 Finch Farm Rd
- 3181 Finch Farm Rd
- 2377 Greenbrook Dr
- 3066 Finch Farm Rd
- 3054 Finch Farm Rd
- 3344 Finch Farm Rd
- 3135 Finch Farm Rd
Your Personal Tour Guide
Ask me questions while you tour the home.