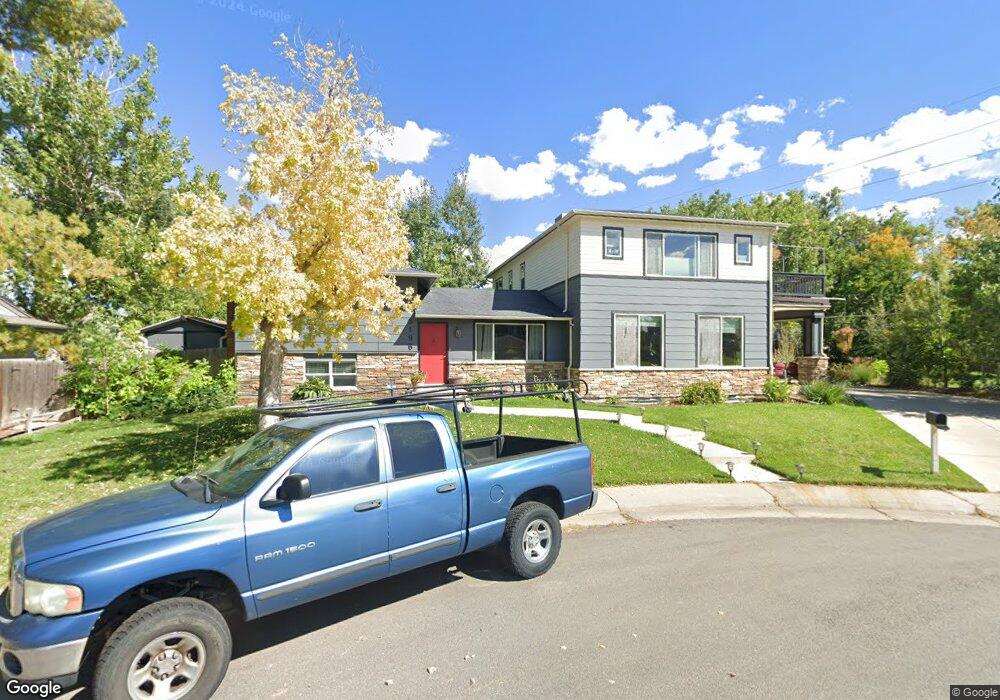
3196 S Emporia Ct Denver, CO 80231
Hampden NeighborhoodEstimated Value: $603,000 - $730,000
2
Beds
3
Baths
1,669
Sq Ft
$393/Sq Ft
Est. Value
About This Home
This home is located at 3196 S Emporia Ct, Denver, CO 80231 and is currently estimated at $655,645, approximately $392 per square foot. 3196 S Emporia Ct is a home located in Denver County with nearby schools including Holm Elementary School, Joe Shoemaker School, and Samuels Elementary School.
Ownership History
Date
Name
Owned For
Owner Type
Purchase Details
Closed on
Dec 27, 2011
Sold by
Nash Kimberly A Margolis and Nash Gregory S
Bought by
Nash Kimberly A Margolis
Current Estimated Value
Home Financials for this Owner
Home Financials are based on the most recent Mortgage that was taken out on this home.
Original Mortgage
$417,000
Outstanding Balance
$286,702
Interest Rate
4.04%
Mortgage Type
New Conventional
Estimated Equity
$368,943
Purchase Details
Closed on
Nov 18, 2002
Sold by
Margolis Kimberly A and Nash Gregory S
Bought by
Nash Kimberly A Margolis and Nash Gregory S
Home Financials for this Owner
Home Financials are based on the most recent Mortgage that was taken out on this home.
Original Mortgage
$179,200
Interest Rate
5.89%
Purchase Details
Closed on
Aug 22, 2000
Sold by
Pittman Clyte D
Bought by
Margolis Kimberly A and Nash Gregory S
Home Financials for this Owner
Home Financials are based on the most recent Mortgage that was taken out on this home.
Original Mortgage
$196,851
Interest Rate
8.15%
Mortgage Type
FHA
Create a Home Valuation Report for This Property
The Home Valuation Report is an in-depth analysis detailing your home's value as well as a comparison with similar homes in the area
Home Values in the Area
Average Home Value in this Area
Purchase History
| Date | Buyer | Sale Price | Title Company |
|---|---|---|---|
| Nash Kimberly A Margolis | -- | Fitco | |
| Nash Kimberly A Margolis | -- | -- | |
| Margolis Kimberly A | $199,450 | First American Heritage Titl |
Source: Public Records
Mortgage History
| Date | Status | Borrower | Loan Amount |
|---|---|---|---|
| Open | Nash Kimberly A Margolis | $417,000 | |
| Closed | Nash Kimberly A Margolis | $179,200 | |
| Closed | Margolis Kimberly A | $196,851 |
Source: Public Records
Tax History Compared to Growth
Tax History
| Year | Tax Paid | Tax Assessment Tax Assessment Total Assessment is a certain percentage of the fair market value that is determined by local assessors to be the total taxable value of land and additions on the property. | Land | Improvement |
|---|---|---|---|---|
| 2024 | $3,696 | $46,670 | $10,310 | $36,360 |
| 2023 | $3,616 | $46,670 | $10,310 | $36,360 |
| 2022 | $2,538 | $31,920 | $14,520 | $17,400 |
| 2021 | $2,450 | $32,840 | $14,940 | $17,900 |
| 2020 | $2,786 | $37,550 | $14,940 | $22,610 |
| 2019 | $2,708 | $37,550 | $14,940 | $22,610 |
| 2018 | $2,481 | $32,070 | $15,040 | $17,030 |
| 2017 | $2,474 | $32,070 | $15,040 | $17,030 |
| 2016 | $2,535 | $31,090 | $13,126 | $17,964 |
| 2015 | $2,429 | $31,090 | $13,126 | $17,964 |
| 2014 | $2,147 | $25,850 | $7,164 | $18,686 |
Source: Public Records
Map
Nearby Homes
- 3158 S Dayton Ct
- 3062 S Florence Ct
- 3320 S Fulton Ct
- 3309 S Galena Ct
- 3404 S Clinton Ct
- 2777 S Elmira St Unit 10
- 2770 S Elmira St Unit 157
- 9424 E Girard Ave
- 9230 E Girard Ave Unit 7
- 9440 E Girard Ave Unit 1
- 2685 S Dayton Way Unit 282
- 2685 S Dayton Way Unit 141
- 2685 S Dayton Way Unit 105
- 2685 S Dayton Way Unit 273
- 2685 S Dayton Way Unit 81
- 2685 S Dayton Way Unit 253
- 2685 S Dayton Way Unit 326
- 10000 E Yale Ave Unit 55
- 10000 E Yale Ave Unit 57
- 10000 E Yale Ave Unit 58
- 3176 S Emporia Ct
- 3195 S Elmira Ct
- 3166 S Emporia Ct
- 3197 S Emporia Ct
- 3187 S Emporia Ct
- 3167 S Emporia Ct
- 3206 S Emporia Ct
- 3165 S Elmira Ct
- 3215 S Elmira Ct
- 3156 S Emporia Ct
- 3155 S Elmira Ct
- 3217 S Emporia Ct
- 3198 S Dayton Ct
- 3226 S Emporia Ct
- 3194 S Elmira Ct
- 3188 S Dayton Ct
- 3164 S Elmira Ct
- 3147 S Emporia Ct
- 3178 S Dayton Ct
- 3235 S Elmira Ct