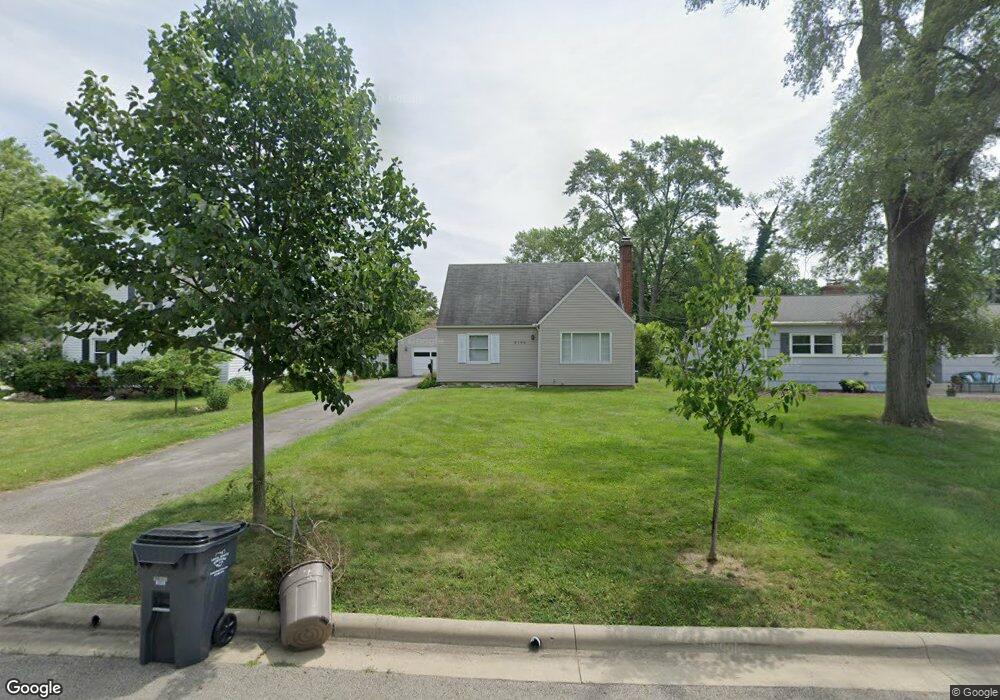
3198 Kenyon Rd Columbus, OH 43221
Estimated Value: $246,000 - $268,000
3
Beds
2
Baths
1,167
Sq Ft
$222/Sq Ft
Est. Value
About This Home
This home is located at 3198 Kenyon Rd, Columbus, OH 43221 and is currently estimated at $258,767, approximately $221 per square foot. 3198 Kenyon Rd is a home located in Franklin County with nearby schools including Tremont Elementary School, Jones Middle School, and Upper Arlington High School.
Ownership History
Date
Name
Owned For
Owner Type
Purchase Details
Closed on
Jul 24, 2020
Sold by
Mccarty Cody L and Mccarty Generose V
Bought by
Guinto Matthew W
Current Estimated Value
Home Financials for this Owner
Home Financials are based on the most recent Mortgage that was taken out on this home.
Original Mortgage
$160,538
Outstanding Balance
$141,399
Interest Rate
3.1%
Mortgage Type
FHA
Estimated Equity
$117,368
Purchase Details
Closed on
Jun 19, 2017
Sold by
Steuer Sandra
Bought by
Mccarty Cody L and Ybarra Generose V
Home Financials for this Owner
Home Financials are based on the most recent Mortgage that was taken out on this home.
Original Mortgage
$132,050
Interest Rate
4.05%
Mortgage Type
New Conventional
Purchase Details
Closed on
Feb 24, 2017
Sold by
Hanson Sarah
Bought by
Steuer Sandra
Create a Home Valuation Report for This Property
The Home Valuation Report is an in-depth analysis detailing your home's value as well as a comparison with similar homes in the area
Home Values in the Area
Average Home Value in this Area
Purchase History
| Date | Buyer | Sale Price | Title Company |
|---|---|---|---|
| Guinto Matthew W | $163,500 | Crown Search Services Ltd | |
| Mccarty Cody L | $139,000 | Title First Agency Inc | |
| Steuer Sandra | $88,000 | None Available |
Source: Public Records
Mortgage History
| Date | Status | Borrower | Loan Amount |
|---|---|---|---|
| Open | Guinto Matthew W | $160,538 | |
| Previous Owner | Mccarty Cody L | $132,050 |
Source: Public Records
Tax History
| Year | Tax Paid | Tax Assessment Tax Assessment Total Assessment is a certain percentage of the fair market value that is determined by local assessors to be the total taxable value of land and additions on the property. | Land | Improvement |
|---|---|---|---|---|
| 2025 | $3,236 | $76,310 | $23,280 | $53,030 |
| 2024 | $3,236 | $76,310 | $23,280 | $53,030 |
| 2023 | $3,205 | $76,310 | $23,280 | $53,030 |
| 2022 | $2,299 | $45,540 | $8,820 | $36,720 |
| 2021 | $2,306 | $45,540 | $8,820 | $36,720 |
| 2020 | $2,289 | $45,120 | $8,820 | $36,300 |
| 2019 | $2,124 | $37,450 | $7,350 | $30,100 |
| 2018 | $2,038 | $37,450 | $7,350 | $30,100 |
| 2017 | $1,928 | $33,670 | $7,350 | $26,320 |
| 2016 | $1,917 | $30,600 | $7,600 | $23,000 |
| 2015 | $1,938 | $30,600 | $7,600 | $23,000 |
| 2014 | $1,960 | $30,600 | $7,600 | $23,000 |
| 2013 | $863 | $32,200 | $7,980 | $24,220 |
Source: Public Records
Map
Nearby Homes
- 3194 Mountview Rd
- 2227 Zollinger Rd
- 3134 Asbury Dr
- 2390 Zollinger Rd
- 2257 Swansea Rd
- 2375 Swansea Rd
- 2979 Avalon Rd
- 3134 Herrick Rd
- 3163 S Dorchester Rd
- 2424 Nottingham Rd
- 2443 Shrewsbury Rd
- 3106 Somerford Rd
- 1872 Kentwell Rd Unit 1872
- 2480 Shrewsbury Rd
- 1842 Ridgecliff Rd
- 2413 Edgevale Rd
- 2729 Eastcleft Dr
- 1744 Ridgecliff Rd Unit 12
- 2666 Woodstock Rd
- 2458 Edgevale Rd
- 3192 Kenyon Rd
- 3204 Kenyon Rd
- 3186 Kenyon Rd
- 3180 Kenyon Rd
- 2253 Eastcleft Dr
- 3174 Kenyon Rd
- 3196 Kenyon Rd
- 3166 Kenyon Rd
- 3173 Kenyon Rd
- 3169 Kenyon Rd
- 3165 Kenyon Rd
- 3188 Kenyon Rd
- 2234 Eastcleft Dr
- 3159 Kenyon Rd
- 3210 Kenyon Rd
- 3205 Kenyon Rd
- 3197 Kenyon Rd
- 3216 Kenyon Rd
- 3197 Mountview Rd
- 3182 Kenyon Rd
Your Personal Tour Guide
Ask me questions while you tour the home.