Estimated Value: $445,000 - $462,000
3
Beds
2
Baths
1,340
Sq Ft
$340/Sq Ft
Est. Value
About This Home
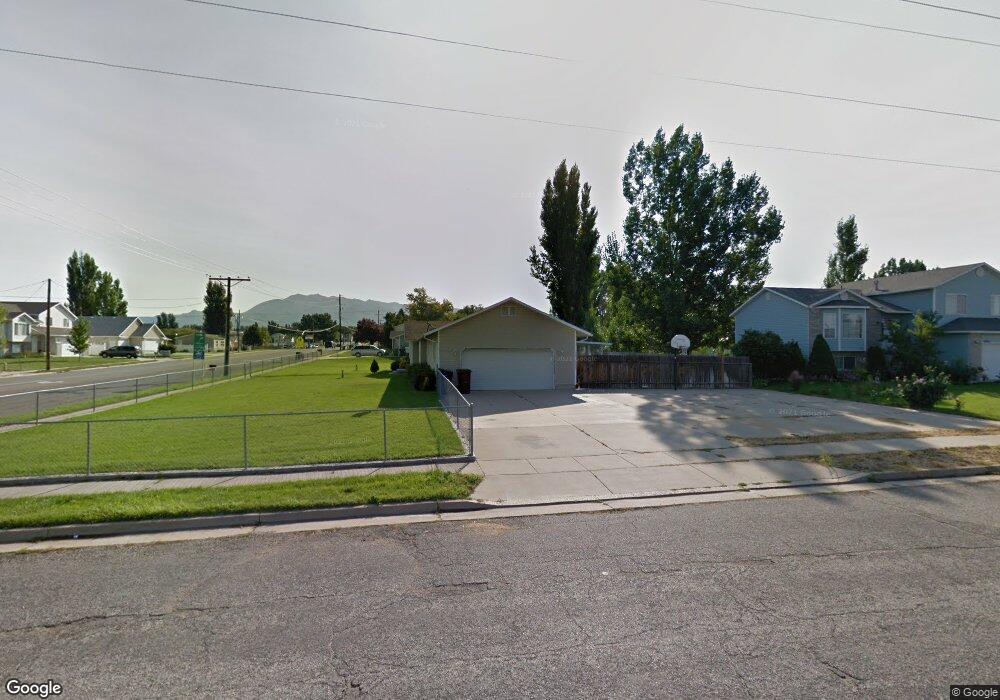
This home is located at 3199 W 4800 S, Roy, UT 84067 and is currently estimated at $455,729, approximately $340 per square foot. 3199 W 4800 S is a home located in Weber County with nearby schools including Midland School, Sand Ridge Junior High School, and Roy High School.
Ownership History
Date
Name
Owned For
Owner Type
Purchase Details
Closed on
Nov 30, 2023
Sold by
Peterson Curt E and Weber Roy
Bought by
Bills Samantha and Bills Trent
Current Estimated Value
Purchase Details
Closed on
Aug 30, 2023
Sold by
Bills Samantha and Bills Trent
Bought by
Bills Samantha and Bills Trent
Home Financials for this Owner
Home Financials are based on the most recent Mortgage that was taken out on this home.
Original Mortgage
$160,000
Interest Rate
6.78%
Mortgage Type
New Conventional
Purchase Details
Closed on
Jan 30, 2015
Sold by
Peterson Curt E and Bills Samantha
Bought by
Bills Samantha and Bills Trent
Purchase Details
Closed on
May 5, 2009
Sold by
Peterson Curt E and Bills Samantha
Bought by
Peterson Curt E and Bills Samantha
Create a Home Valuation Report for This Property
The Home Valuation Report is an in-depth analysis detailing your home's value as well as a comparison with similar homes in the area
Home Values in the Area
Average Home Value in this Area
Purchase History
| Date | Buyer | Sale Price | Title Company |
|---|---|---|---|
| Bills Samantha | -- | None Listed On Document | |
| Bills Samantha | -- | First American Title | |
| Bills Samantha | -- | Lincoln Title Ins Agency | |
| Peterson Curt E | -- | None Available |
Source: Public Records
Mortgage History
| Date | Status | Borrower | Loan Amount |
|---|---|---|---|
| Previous Owner | Bills Samantha | $160,000 |
Source: Public Records
Tax History
| Year | Tax Paid | Tax Assessment Tax Assessment Total Assessment is a certain percentage of the fair market value that is determined by local assessors to be the total taxable value of land and additions on the property. | Land | Improvement |
|---|---|---|---|---|
| 2025 | $2,770 | $434,396 | $171,543 | $262,853 |
| 2024 | $2,710 | $235,399 | $94,356 | $141,043 |
| 2023 | $2,572 | $406,000 | $135,147 | $270,853 |
| 2022 | $2,801 | $458,000 | $125,134 | $332,866 |
| 2021 | $2,197 | $322,000 | $95,766 | $226,234 |
| 2020 | $2,092 | $282,000 | $95,766 | $186,234 |
| 2019 | $2,036 | $259,000 | $57,979 | $201,021 |
| 2018 | $1,898 | $227,000 | $52,825 | $174,175 |
| 2017 | $1,651 | $183,000 | $52,825 | $130,175 |
| 2016 | $1,593 | $95,148 | $26,781 | $68,367 |
| 2015 | $1,462 | $89,152 | $26,781 | $62,371 |
| 2014 | $1,448 | $87,474 | $26,781 | $60,693 |
Source: Public Records
Map
Nearby Homes
- 3077 W 4650 S
- 4891 S 2875 W
- 5009 S 2925 W
- 4510 Stone Creek Rd Unit F
- 3512 W 4835 S Unit 24
- 3509 W 4835 S Unit 26
- 3517 W 4835 S Unit 27
- 3405 W 4525 S
- 4491 Haven Creek Rd Unit A
- 5003 S 2825 W
- 5141 S 2975 W
- 4435 Cross Creek Rd Unit 29C
- 3434 W 4525 S
- 5063 S 2825 W
- 2817 W 5000 S
- 4732 S West Park Dr
- 5173 S 2825 W
- 3443 W 5200 S Unit 2&3
- 4919 S 2675 W
- 5304 S 3100 W
- 4816 S 3200 W
- 3127 W 4800 S
- 3190 W 4800 S
- 4822 S 3200 W
- 3140 W 4800 S
- 3140 W 4800 S Unit 4
- 3160 W 4800 S Unit 5
- 4815 S 3200 W
- 3115 W 4800 S
- 4791 S 3200 W
- 4791 S 3200 W Unit 11
- 4821 S 3200 W
- 4809 S 3200 W
- 3120 W 4800 S
- 4836 S 3200 W
- 3173 W 4750 S
- 3173 W 4750 S Unit 4
- 3105 W 4800 S
- 3183 W 4750 S
- 3183 W 4750 S Unit 5