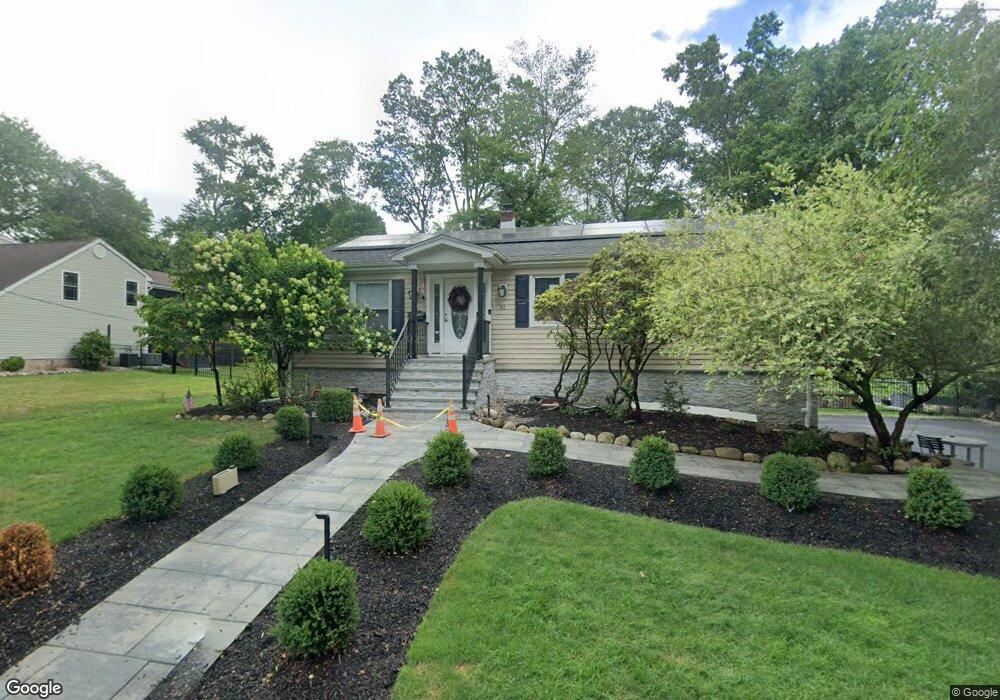
32 2nd St Harrington Park, NJ 07640
Estimated Value: $867,000 - $923,000
3
Beds
2
Baths
1,891
Sq Ft
$472/Sq Ft
Est. Value
About This Home
This home is located at 32 2nd St, Harrington Park, NJ 07640 and is currently estimated at $892,069, approximately $471 per square foot. 32 2nd St is a home located in Bergen County with nearby schools including Norwood Public School and Northern Valley Regional High School at Old Tappan.
Ownership History
Date
Name
Owned For
Owner Type
Purchase Details
Closed on
Jul 24, 2020
Sold by
Park Junghun and Park Eunha
Bought by
Dao Alexander K and Dao Brandy E
Current Estimated Value
Home Financials for this Owner
Home Financials are based on the most recent Mortgage that was taken out on this home.
Original Mortgage
$510,000
Outstanding Balance
$451,387
Interest Rate
3%
Mortgage Type
New Conventional
Estimated Equity
$440,682
Purchase Details
Closed on
Jun 23, 2014
Sold by
Wells Fargo Bank Na
Bought by
Park Junghun and Park Eunha
Home Financials for this Owner
Home Financials are based on the most recent Mortgage that was taken out on this home.
Original Mortgage
$227,450
Interest Rate
4.18%
Mortgage Type
New Conventional
Purchase Details
Closed on
Aug 17, 2001
Sold by
Vallis Dean
Bought by
Suk Yong and Lee Ji Y
Home Financials for this Owner
Home Financials are based on the most recent Mortgage that was taken out on this home.
Original Mortgage
$385,000
Interest Rate
6.93%
Create a Home Valuation Report for This Property
The Home Valuation Report is an in-depth analysis detailing your home's value as well as a comparison with similar homes in the area
Home Values in the Area
Average Home Value in this Area
Purchase History
| Date | Buyer | Sale Price | Title Company |
|---|---|---|---|
| Dao Alexander K | $600,000 | None Available | |
| Park Junghun | $454,900 | -- | |
| Suk Yong | $435,000 | -- |
Source: Public Records
Mortgage History
| Date | Status | Borrower | Loan Amount |
|---|---|---|---|
| Open | Dao Alexander K | $510,000 | |
| Previous Owner | Park Junghun | $227,450 | |
| Previous Owner | Suk Yong | $385,000 |
Source: Public Records
Tax History Compared to Growth
Tax History
| Year | Tax Paid | Tax Assessment Tax Assessment Total Assessment is a certain percentage of the fair market value that is determined by local assessors to be the total taxable value of land and additions on the property. | Land | Improvement |
|---|---|---|---|---|
| 2025 | $15,363 | $491,300 | $278,000 | $213,300 |
| 2024 | $14,891 | $491,300 | $278,000 | $213,300 |
| 2023 | $14,646 | $491,300 | $278,000 | $213,300 |
| 2022 | $14,646 | $491,300 | $278,000 | $213,300 |
| 2021 | $14,542 | $491,300 | $278,000 | $213,300 |
| 2020 | $14,479 | $491,300 | $278,000 | $213,300 |
| 2019 | $14,174 | $491,300 | $278,000 | $213,300 |
| 2018 | $13,914 | $491,300 | $278,000 | $213,300 |
| 2017 | $13,766 | $491,300 | $278,000 | $213,300 |
| 2016 | $12,984 | $477,000 | $278,000 | $199,000 |
| 2015 | $12,660 | $477,000 | $278,000 | $199,000 |
| 2014 | $12,369 | $477,000 | $278,000 | $199,000 |
Source: Public Records
Map
Nearby Homes
- 959 Broadway
- 48 Flint Terrace
- 401 Dercole Ct Unit 332
- 401 Dercole Ct Unit 127
- 401 Dercole Ct Unit 319
- 401 Dercole Ct Unit CT114
- 121 Winding Creek
- 323 Rivervale Ave
- 192 White Ave
- 291 Tappan Rd
- 26 Garnett Place
- 5 Kenyon Ct
- 979 Blanch Ave
- 40 Virgil Rd
- 4 Michelle Ct
- 136 Tappan Rd
- 443 Lynn St
- 412 Tappan Rd
- 1011 Washington Ave S
- 312 Lambert Ave