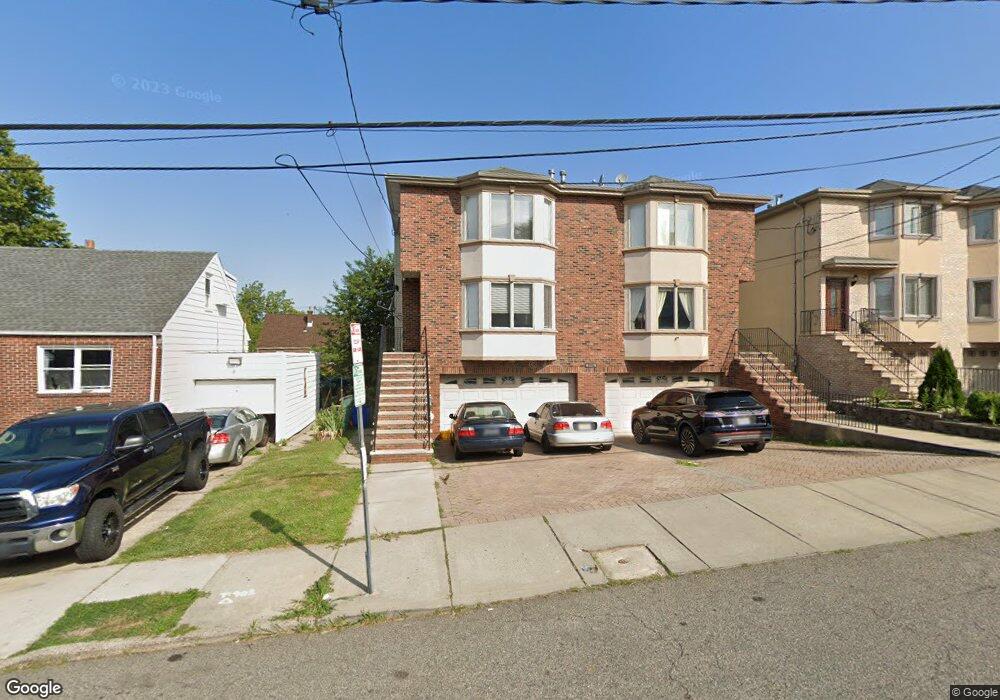
32 8th St Fairview, NJ 07022
Estimated Value: $933,000 - $1,373,000
Studio
--
Bath
4,008
Sq Ft
$302/Sq Ft
Est. Value
About This Home
This home is located at 32 8th St, Fairview, NJ 07022 and is currently estimated at $1,209,022, approximately $301 per square foot. 32 8th St is a home located in Bergen County with nearby schools including The Annex Elementary School, Lincoln Elementary School, and Number Three School.
Ownership History
Date
Name
Owned For
Owner Type
Purchase Details
Closed on
Oct 21, 2013
Sold by
Psonis John
Bought by
Navi Hoshmand
Current Estimated Value
Purchase Details
Closed on
Jan 11, 2006
Sold by
Mac Brothers Developers Llc
Bought by
Psonis John
Home Financials for this Owner
Home Financials are based on the most recent Mortgage that was taken out on this home.
Original Mortgage
$728,000
Interest Rate
6.34%
Purchase Details
Closed on
Dec 30, 2004
Sold by
Dominguez Ernest
Bought by
Mac Brothers Developers Llc
Purchase Details
Closed on
Apr 28, 2003
Sold by
Dominguez Ernest
Bought by
Dominguez Ernest and Dominguez Sandra
Purchase Details
Closed on
Jun 28, 1999
Sold by
Larose Patricia
Bought by
Dominguez Sandra
Home Financials for this Owner
Home Financials are based on the most recent Mortgage that was taken out on this home.
Original Mortgage
$160,000
Interest Rate
7.19%
Mortgage Type
Stand Alone First
Create a Home Valuation Report for This Property
The Home Valuation Report is an in-depth analysis detailing your home's value as well as a comparison with similar homes in the area
Home Values in the Area
Average Home Value in this Area
Purchase History
| Date | Buyer | Sale Price | Title Company |
|---|---|---|---|
| Navi Hoshmand | $830,000 | -- | |
| Psonis John | $1,040,000 | -- | |
| Mac Brothers Developers Llc | $439,000 | -- | |
| Dominguez Ernest | -- | -- | |
| Dominguez Sandra | $185,000 | -- |
Source: Public Records
Mortgage History
| Date | Status | Borrower | Loan Amount |
|---|---|---|---|
| Previous Owner | Psonis John | $728,000 | |
| Previous Owner | Dominguez Sandra | $160,000 |
Source: Public Records
Tax History
| Year | Tax Paid | Tax Assessment Tax Assessment Total Assessment is a certain percentage of the fair market value that is determined by local assessors to be the total taxable value of land and additions on the property. | Land | Improvement |
|---|---|---|---|---|
| 2025 | $22,593 | $998,700 | $261,000 | $737,700 |
| 2024 | $21,430 | $976,800 | $251,000 | $725,800 |
| 2023 | $20,902 | $947,800 | $246,000 | $701,800 |
| 2022 | $20,902 | $899,000 | $226,000 | $673,000 |
| 2021 | $21,210 | $855,600 | $211,000 | $644,600 |
| 2020 | $21,457 | $829,400 | $206,000 | $623,400 |
| 2019 | $22,606 | $673,600 | $150,800 | $522,800 |
| 2018 | $22,673 | $673,600 | $150,800 | $522,800 |
| 2017 | $21,959 | $673,600 | $150,800 | $522,800 |
| 2016 | $20,754 | $673,600 | $150,800 | $522,800 |
| 2015 | $19,662 | $673,600 | $150,800 | $522,800 |
| 2014 | $19,225 | $673,600 | $150,800 | $522,800 |
Source: Public Records
Map
Nearby Homes
- 220-222 8th St
- 305 8th St Unit 2
- 305 8th St
- 385A Roosevelt St
- 423 Walker St Unit B5
- 233 5th St Unit B
- 615 Prospect Ave Unit B
- 615B Prospect Ave
- 220 5th St
- 373 Mckinley St
- 3 Linda Ln
- 465B Cliff St Unit B
- 614E Fairview Ave Unit E
- 439 Cliff St
- 411 Sheridan Place
- 398 Cliff St
- 447 Fairview Ave Unit 304
- 174 Maple St
- 440 Morningside Ave Unit B
- 320 Anderson Ave Unit 1B
Your Personal Tour Guide
Ask me questions while you tour the home.