32 9th St Unit 2nd floor Providence, RI 02906
Hope NeighborhoodEstimated Value: $711,000 - $781,956
4
Beds
2
Baths
2,799
Sq Ft
$268/Sq Ft
Est. Value
About This Home
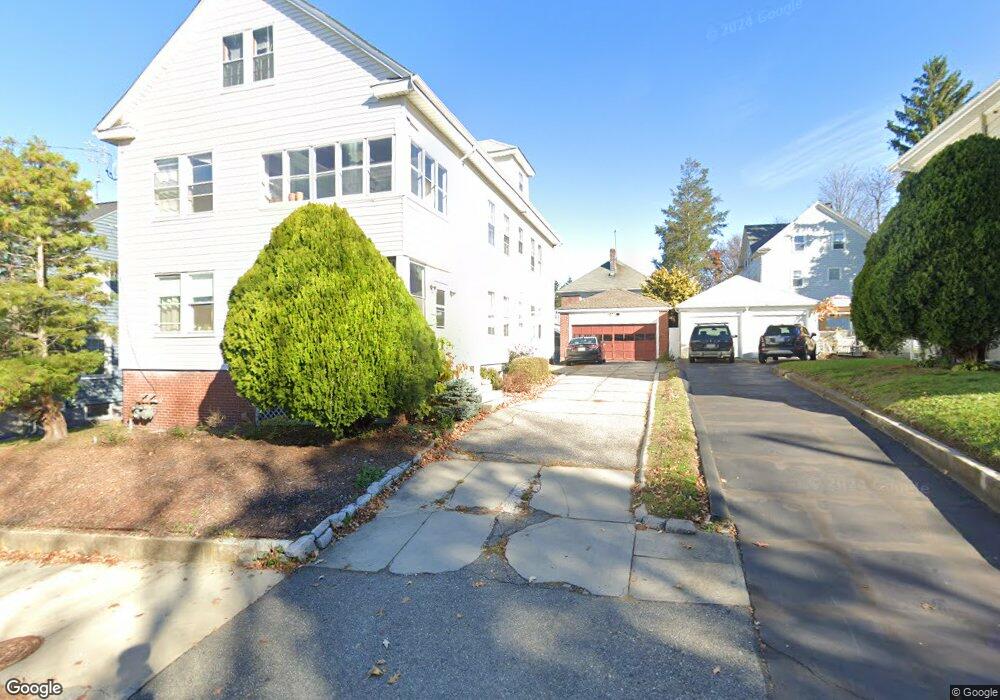
This home is located at 32 9th St Unit 2nd floor, Providence, RI 02906 and is currently estimated at $748,739, approximately $267 per square foot. 32 9th St Unit 2nd floor is a home located in Providence County with nearby schools including Jewish Community Day School Of Rhode Island, Ocean Tides School, and Bishop Keough Regional High School.
Ownership History
Date
Name
Owned For
Owner Type
Purchase Details
Closed on
Oct 1, 2013
Sold by
Massouda Abraham and Massouda Kamal
Bought by
Otto Charles S and Grant Carol J
Current Estimated Value
Home Financials for this Owner
Home Financials are based on the most recent Mortgage that was taken out on this home.
Original Mortgage
$143,200
Outstanding Balance
$105,638
Interest Rate
4.42%
Mortgage Type
New Conventional
Estimated Equity
$643,101
Create a Home Valuation Report for This Property
The Home Valuation Report is an in-depth analysis detailing your home's value as well as a comparison with similar homes in the area
Home Values in the Area
Average Home Value in this Area
Purchase History
| Date | Buyer | Sale Price | Title Company |
|---|---|---|---|
| Otto Charles S | $191,000 | -- | |
| Otto Charles S | $191,000 | -- |
Source: Public Records
Mortgage History
| Date | Status | Borrower | Loan Amount |
|---|---|---|---|
| Open | Otto Charles S | $143,200 | |
| Closed | Otto Charles S | $143,200 |
Source: Public Records
Tax History
| Year | Tax Paid | Tax Assessment Tax Assessment Total Assessment is a certain percentage of the fair market value that is determined by local assessors to be the total taxable value of land and additions on the property. | Land | Improvement |
|---|---|---|---|---|
| 2025 | $10,907 | $779,100 | $377,200 | $401,900 |
| 2024 | $9,955 | $542,500 | $254,200 | $288,300 |
| 2023 | $9,955 | $542,500 | $254,200 | $288,300 |
| 2022 | $9,657 | $542,500 | $254,200 | $288,300 |
| 2021 | $9,834 | $400,400 | $208,200 | $192,200 |
| 2020 | $9,834 | $400,400 | $208,200 | $192,200 |
| 2019 | $9,834 | $400,400 | $208,200 | $192,200 |
| 2018 | $9,607 | $300,600 | $180,300 | $120,300 |
| 2017 | $9,607 | $300,600 | $180,300 | $120,300 |
| 2016 | $9,607 | $300,600 | $180,300 | $120,300 |
| 2015 | $8,867 | $267,900 | $168,300 | $99,600 |
| 2014 | $9,042 | $267,900 | $168,300 | $99,600 |
| 2013 | $9,042 | $267,900 | $168,300 | $99,600 |
Source: Public Records
Map
Nearby Homes
- 15 11th St
- 80 Hillside Ave
- 32 Carver St
- 136 Hillside Ave
- 41 Campbell Terrace
- 153 4th St
- 6 Alfred Stone Rd
- 122 Lowden St
- 21 Dexterdale Rd
- 89 Dexterdale Rd
- 750 Elmgrove Ave
- 152 Colonial Rd Unit 152
- 62 Harwich Rd
- 5 Lowden St
- 39 Harwich Rd
- 50 Batcheller Ave
- 540 Blackstone Blvd
- 104 Woodbine St
- 19 Brockton St
- 169 Ivy St Unit 2
Your Personal Tour Guide
Ask me questions while you tour the home.