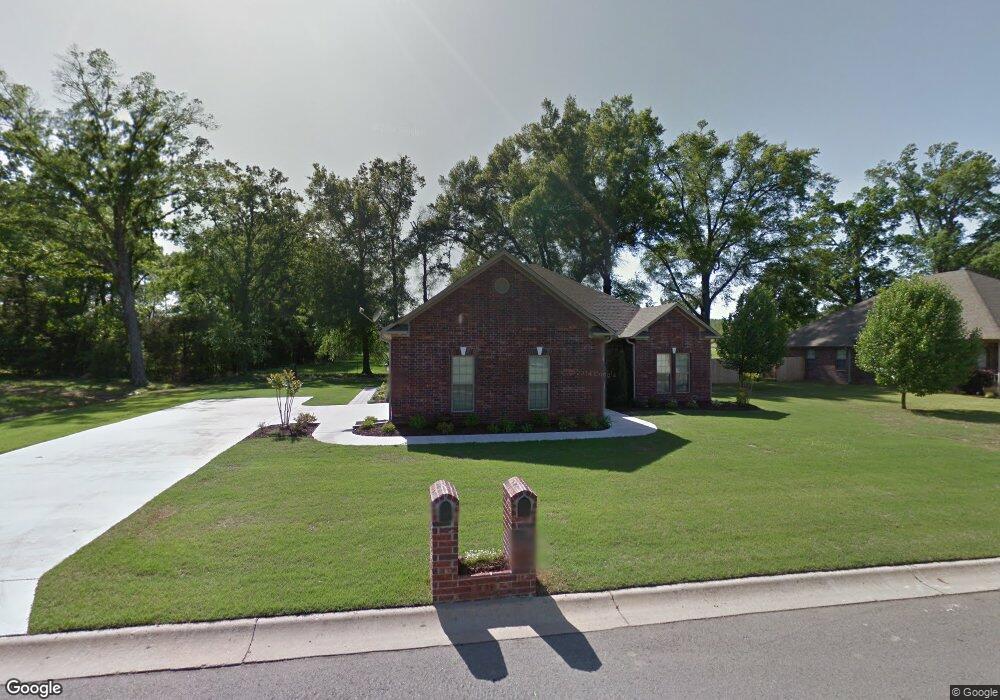
32 Abiagayle Loop Morrilton, AR 72110
Estimated Value: $280,463 - $317,000
--
Bed
2
Baths
1,994
Sq Ft
$150/Sq Ft
Est. Value
About This Home
This home is located at 32 Abiagayle Loop, Morrilton, AR 72110 and is currently estimated at $298,616, approximately $149 per square foot. 32 Abiagayle Loop is a home located in Conway County with nearby schools including Morrilton Primary School, Morrilton Elementary School, and Morrilton Intermediate School.
Ownership History
Date
Name
Owned For
Owner Type
Purchase Details
Closed on
Feb 9, 2018
Sold by
Bratton Joseph A and Bratton Jamie F
Bought by
Mariott Aaron and Mariott Lori
Current Estimated Value
Home Financials for this Owner
Home Financials are based on the most recent Mortgage that was taken out on this home.
Original Mortgage
$188,790
Outstanding Balance
$159,888
Interest Rate
3.99%
Mortgage Type
VA
Estimated Equity
$138,728
Purchase Details
Closed on
Nov 21, 2014
Sold by
Ronnie Ronnie
Bought by
Bratton Joseph A and Bratton Jamie F
Home Financials for this Owner
Home Financials are based on the most recent Mortgage that was taken out on this home.
Original Mortgage
$175,750
Interest Rate
3.93%
Mortgage Type
Stand Alone Refi Refinance Of Original Loan
Purchase Details
Closed on
Sep 28, 2012
Sold by
Horn-Stobaugh Properties Llc
Bought by
Horn Ronnie
Purchase Details
Closed on
Oct 1, 2002
Bought by
4J, Inc.
Create a Home Valuation Report for This Property
The Home Valuation Report is an in-depth analysis detailing your home's value as well as a comparison with similar homes in the area
Home Values in the Area
Average Home Value in this Area
Purchase History
| Date | Buyer | Sale Price | Title Company |
|---|---|---|---|
| Mariott Aaron | $197,911 | Morrilton Abstract Co Inc | |
| Bratton Joseph A | $185,000 | -- | |
| Horn Ronnie | -- | -- | |
| 4J, Inc. | -- | -- |
Source: Public Records
Mortgage History
| Date | Status | Borrower | Loan Amount |
|---|---|---|---|
| Open | Mariott Aaron | $188,790 | |
| Previous Owner | Bratton Joseph A | $175,750 | |
| Previous Owner | 4J, Inc. | $20,545 |
Source: Public Records
Tax History Compared to Growth
Tax History
| Year | Tax Paid | Tax Assessment Tax Assessment Total Assessment is a certain percentage of the fair market value that is determined by local assessors to be the total taxable value of land and additions on the property. | Land | Improvement |
|---|---|---|---|---|
| 2024 | $1,753 | $45,580 | $4,860 | $40,720 |
| 2023 | $1,730 | $45,580 | $4,860 | $40,720 |
| 2022 | $1,683 | $45,580 | $4,860 | $40,720 |
| 2021 | $1,585 | $36,220 | $3,630 | $32,590 |
| 2020 | $1,585 | $36,220 | $3,630 | $32,590 |
| 2019 | $1,585 | $36,220 | $3,630 | $32,590 |
| 2018 | $1,610 | $36,220 | $3,630 | $32,590 |
| 2017 | $1,521 | $36,220 | $3,630 | $32,590 |
| 2016 | $1,409 | $32,940 | $3,200 | $29,740 |
| 2015 | $1,281 | $32,940 | $3,200 | $29,740 |
| 2014 | $1,281 | $3,200 | $3,200 | $0 |
Source: Public Records
Map
Nearby Homes
- 43 Sunset Blvd
- 30 Sunny Dr
- 31 Sunny Dr
- 47 Sunset Blvd
- 0 Airport Rd
- 1708 E Holloway
- 00 E Holloway B2 Lots 7 10 and 14 St
- 1501 View St
- 00 Mount Zion Loop
- 99 Sandtown Rd
- 17 Deerwood Dr
- 00 S Bridge St
- 00 Winthrop Dr
- 7 Winthrop Dr
- 607 Branch St
- 311 N Will St
- 38 Sunset Blvd
- 7 Sunset Blvd
- 705 E Commerce St
- 601 Green St
- 28 Abiagayle Loop
- 27 Sunset Blvd
- 38 Abiagayle Loop
- 33 Abiagayle Loop
- Lot 10 Sunset Blvd
- LOT 33 Sunset Blvd
- LOT 34 Sunset Blvd
- LOT 19 Sunset Blvd
- LOT 16 Sunset Blvd
- LOT 13 Sunset Blvd
- LOT 37 Sunset Blvd
- 27 Abiagayle Loop
- 47 Abiagayle Loop
- 24 Abiagayle Loop
- Lot 5 Sunset Blvd
- Lot 29 Sunset Blvd
- LOT 40 Sunset Blvd
- 25 Abiagayle Loop
- 39 Sunset Blvd
- 39 Sunset Blvd