32 Amendola Dr Netcong, NJ 07857
Estimated Value: $475,000 - $553,000
--
Bed
--
Bath
1,720
Sq Ft
$298/Sq Ft
Est. Value
About This Home
This home is located at 32 Amendola Dr, Netcong, NJ 07857 and is currently estimated at $513,320, approximately $298 per square foot. 32 Amendola Dr is a home located in Morris County with nearby schools including Netcong Elementary School, Lenape Val Regional High School, and St. Therese School.
Ownership History
Date
Name
Owned For
Owner Type
Purchase Details
Closed on
Feb 20, 2009
Sold by
Whitmore James G and Whitmore Mary Ann
Bought by
Mosnick James and Mosnick Jeri Delvecchio
Current Estimated Value
Home Financials for this Owner
Home Financials are based on the most recent Mortgage that was taken out on this home.
Original Mortgage
$265,000
Outstanding Balance
$166,614
Interest Rate
5%
Mortgage Type
Purchase Money Mortgage
Estimated Equity
$346,706
Purchase Details
Closed on
May 2, 1995
Sold by
Novembre Robert and Novembre Carol
Bought by
Whitmore James G and Whitmore Mary Ann
Create a Home Valuation Report for This Property
The Home Valuation Report is an in-depth analysis detailing your home's value as well as a comparison with similar homes in the area
Home Values in the Area
Average Home Value in this Area
Purchase History
| Date | Buyer | Sale Price | Title Company |
|---|---|---|---|
| Mosnick James | $305,000 | Fidelity Natl Title Ins Co | |
| Whitmore James G | $155,500 | -- |
Source: Public Records
Mortgage History
| Date | Status | Borrower | Loan Amount |
|---|---|---|---|
| Open | Mosnick James | $265,000 |
Source: Public Records
Tax History Compared to Growth
Tax History
| Year | Tax Paid | Tax Assessment Tax Assessment Total Assessment is a certain percentage of the fair market value that is determined by local assessors to be the total taxable value of land and additions on the property. | Land | Improvement |
|---|---|---|---|---|
| 2025 | $9,742 | $285,100 | $113,300 | $171,800 |
| 2024 | $9,827 | $285,100 | $113,300 | $171,800 |
| 2023 | $9,827 | $285,100 | $113,300 | $171,800 |
| 2022 | $8,904 | $285,100 | $113,300 | $171,800 |
| 2021 | $8,904 | $285,100 | $113,300 | $171,800 |
| 2020 | $9,314 | $302,800 | $165,600 | $137,200 |
| 2019 | $8,866 | $302,800 | $165,600 | $137,200 |
| 2018 | $8,336 | $302,800 | $165,600 | $137,200 |
| 2017 | $8,009 | $302,800 | $165,600 | $137,200 |
| 2016 | $7,791 | $302,800 | $165,600 | $137,200 |
| 2015 | $7,506 | $302,800 | $165,600 | $137,200 |
| 2014 | $7,179 | $302,800 | $165,600 | $137,200 |
Source: Public Records
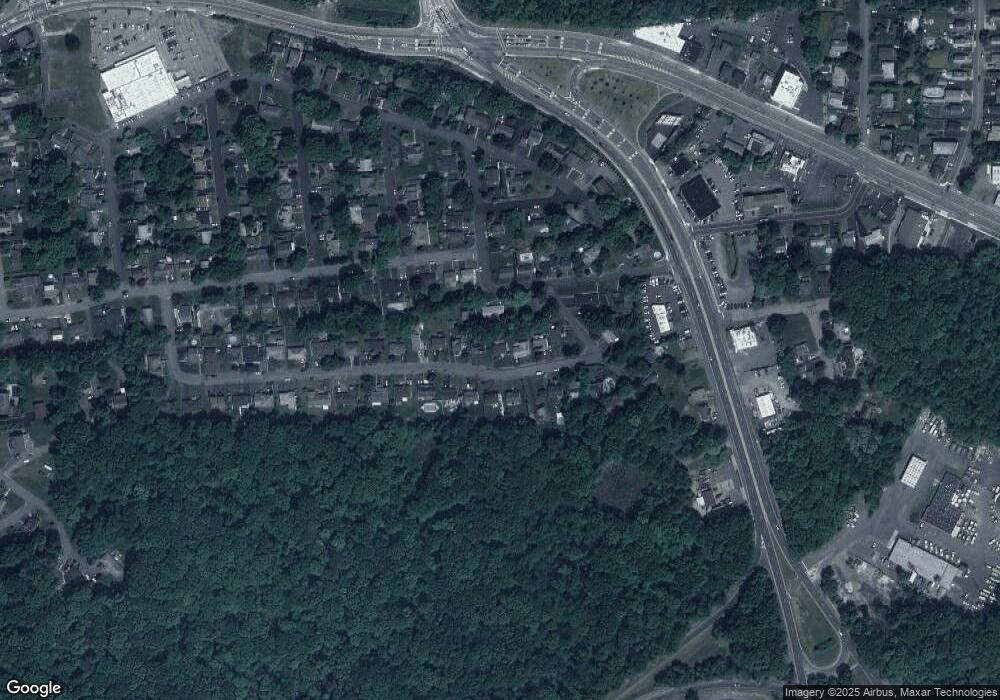
Map
Nearby Homes