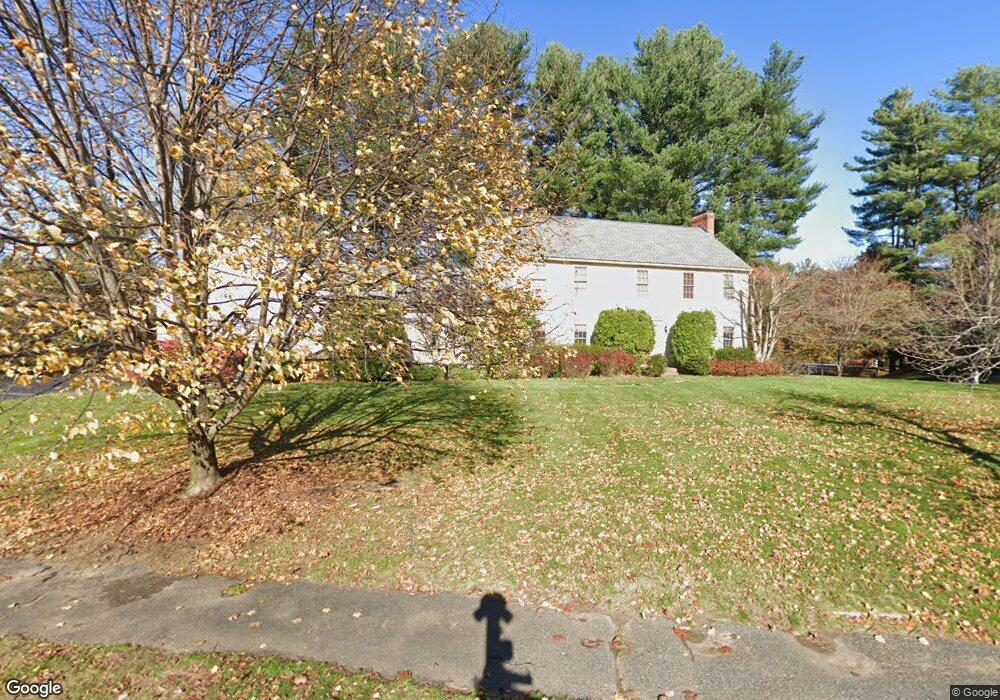
32 Atkinson Ln Sudbury, MA 01776
Estimated Value: $1,380,121 - $2,003,000
4
Beds
3
Baths
3,333
Sq Ft
$480/Sq Ft
Est. Value
About This Home
This home is located at 32 Atkinson Ln, Sudbury, MA 01776 and is currently estimated at $1,600,280, approximately $480 per square foot. 32 Atkinson Ln is a home located in Middlesex County with nearby schools including Peter Noyes Elementary School, Ephraim Curtis Middle School, and Lincoln-Sudbury Regional High School.
Ownership History
Date
Name
Owned For
Owner Type
Purchase Details
Closed on
Feb 14, 1989
Sold by
R K K Rt
Bought by
Fedynyshyn Theodore H
Current Estimated Value
Home Financials for this Owner
Home Financials are based on the most recent Mortgage that was taken out on this home.
Original Mortgage
$440,000
Interest Rate
10.73%
Mortgage Type
Purchase Money Mortgage
Create a Home Valuation Report for This Property
The Home Valuation Report is an in-depth analysis detailing your home's value as well as a comparison with similar homes in the area
Home Values in the Area
Average Home Value in this Area
Purchase History
| Date | Buyer | Sale Price | Title Company |
|---|---|---|---|
| Fedynyshyn Theodore H | $589,900 | -- | |
| Fedynyshyn Theodore H | $589,900 | -- |
Source: Public Records
Mortgage History
| Date | Status | Borrower | Loan Amount |
|---|---|---|---|
| Closed | Fedynyshyn Theodore H | $440,000 | |
| Closed | Fedynyshyn Theodore H | $29,500 |
Source: Public Records
Tax History Compared to Growth
Tax History
| Year | Tax Paid | Tax Assessment Tax Assessment Total Assessment is a certain percentage of the fair market value that is determined by local assessors to be the total taxable value of land and additions on the property. | Land | Improvement |
|---|---|---|---|---|
| 2025 | $19,858 | $1,356,400 | $546,400 | $810,000 |
| 2024 | $19,111 | $1,308,100 | $530,400 | $777,700 |
| 2023 | $17,722 | $1,123,800 | $473,600 | $650,200 |
| 2022 | $17,451 | $966,800 | $434,400 | $532,400 |
| 2021 | $16,570 | $880,000 | $434,400 | $445,600 |
| 2020 | $16,236 | $880,000 | $434,400 | $445,600 |
| 2019 | $15,761 | $880,000 | $434,400 | $445,600 |
| 2018 | $15,565 | $868,100 | $462,000 | $406,100 |
| 2017 | $15,395 | $867,800 | $457,600 | $410,200 |
| 2016 | $14,920 | $838,200 | $440,000 | $398,200 |
| 2015 | $14,539 | $826,100 | $436,000 | $390,100 |
| 2014 | $14,541 | $806,500 | $424,400 | $382,100 |
Source: Public Records
Map
Nearby Homes
- 47 Fairbank Rd
- 4 Elderberry Cir
- 12 Camperdown Ln
- 21 Summer St
- 36 Old Forge Ln
- 14 Tanbark Rd
- 54 Phillips Rd
- 24 Goodnow Rd
- 7 Saddle Ridge Rd
- 55 Widow Rites Ln
- 45 Widow Rites Ln
- 166 Parker St Unit 4
- 30 Rolling Ln
- 67 Old Marlboro Rd
- 143 Peakham Rd
- 5 Taintor Dr
- 270 Old Lancaster Rd
- 25 Bridle Path
- 89 Bridle Path
- 12 Hickory Rd